

 Panel of experts discuss the Delta’s complex hydrodynamics and how flow interacts with salinity, nutrients, contaminants, and the food web
Earlier this year, the Delta Science Program tasked the four former Delta lead scientists with developing a brief report for policy makers and the general public that explains the challenges, complexities, and controversies operating in the Delta. The Delta Challenges Workshop, held in March, gave the scientists a chance to hear perspectives from a number of expert scientists and managers on what they saw as the key challenges working in the Delta.
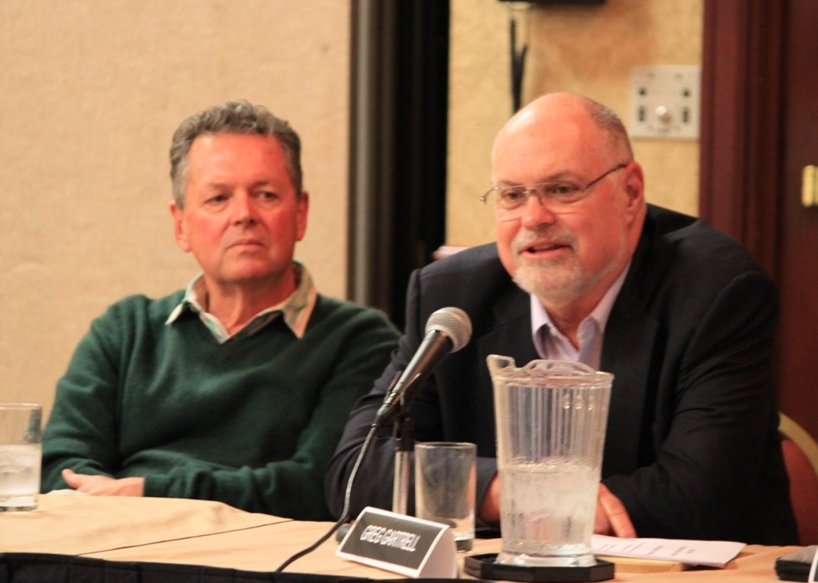
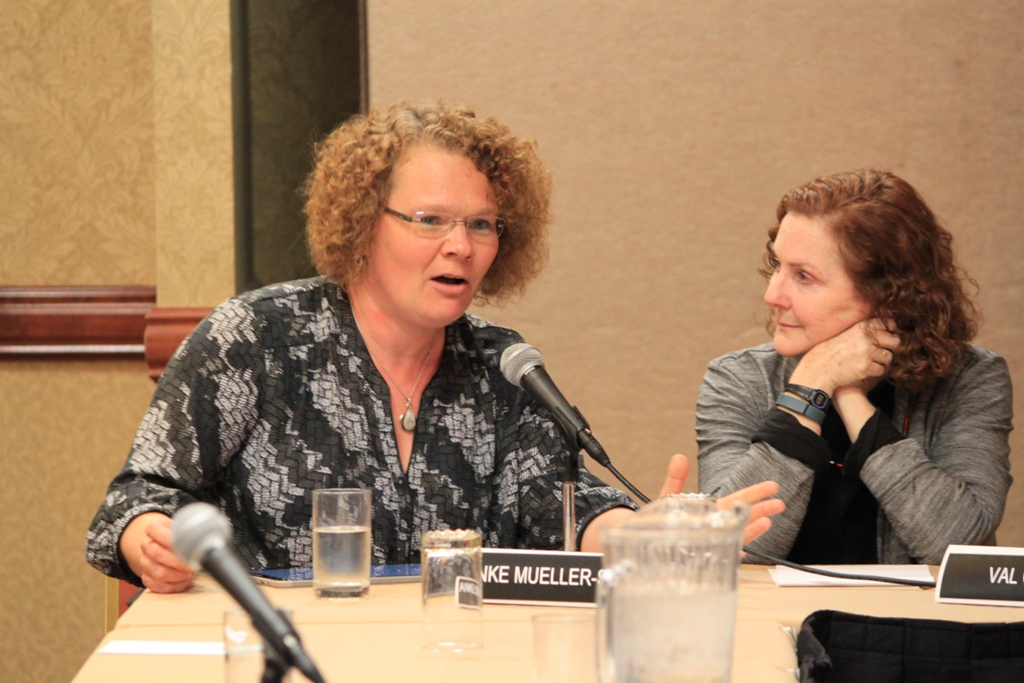
In this third installment of coverage from the workshop, Jon Burau from the USGS discussed the Delta’s complex hydrodynamics; Retired CCWD and now independent consultant Greg Gartrell discussed salinity and diversions, Dr. Jim Cloern gave his thoughts as to why he finds the Delta so complex; Dr. Wim Kimmerer from SFSU discussed the food web, and Dr. Val Connor discussed contaminants. Dr. Anke Mueller-Solger participated in the discussion period.
(For part 1, see: Delta Challenges Workshop, part 1: Delta land use, levees, and agricultural economics; For part 2, see: Delta challenges workshop, part 2: Water supply reliability and its challenges)
Here is what they had to say.
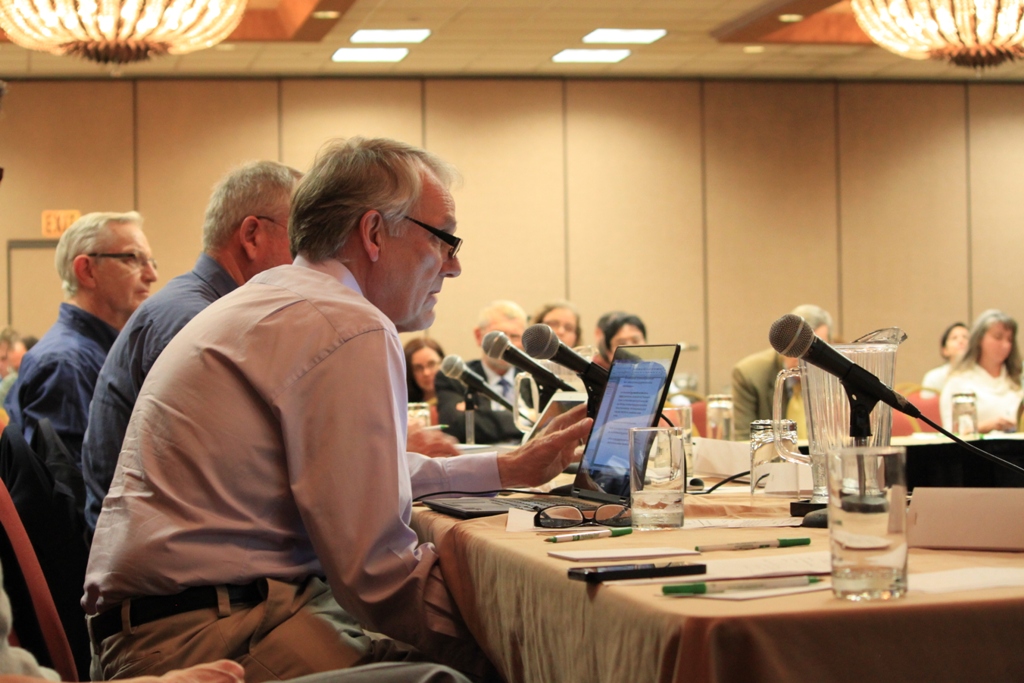
JON BURAU, USGS
Hydrodynamics
 Jon Burau began by saying that the central challenge is to get the correct view of how the estuary is functioning. “That means collecting data,” he said. “I collect hydrodynamic and water quality data. One of the central challenges is collecting data so that we have a decision support system that can tell us what happened. We’re actually fairly decent about telling what happened, but we have challenges collecting data and doing analysis to figure why things happened. It’s usually a lot more expensive, and it will certainly be a challenge when we start implementing the BDCP, if that comes about.”..
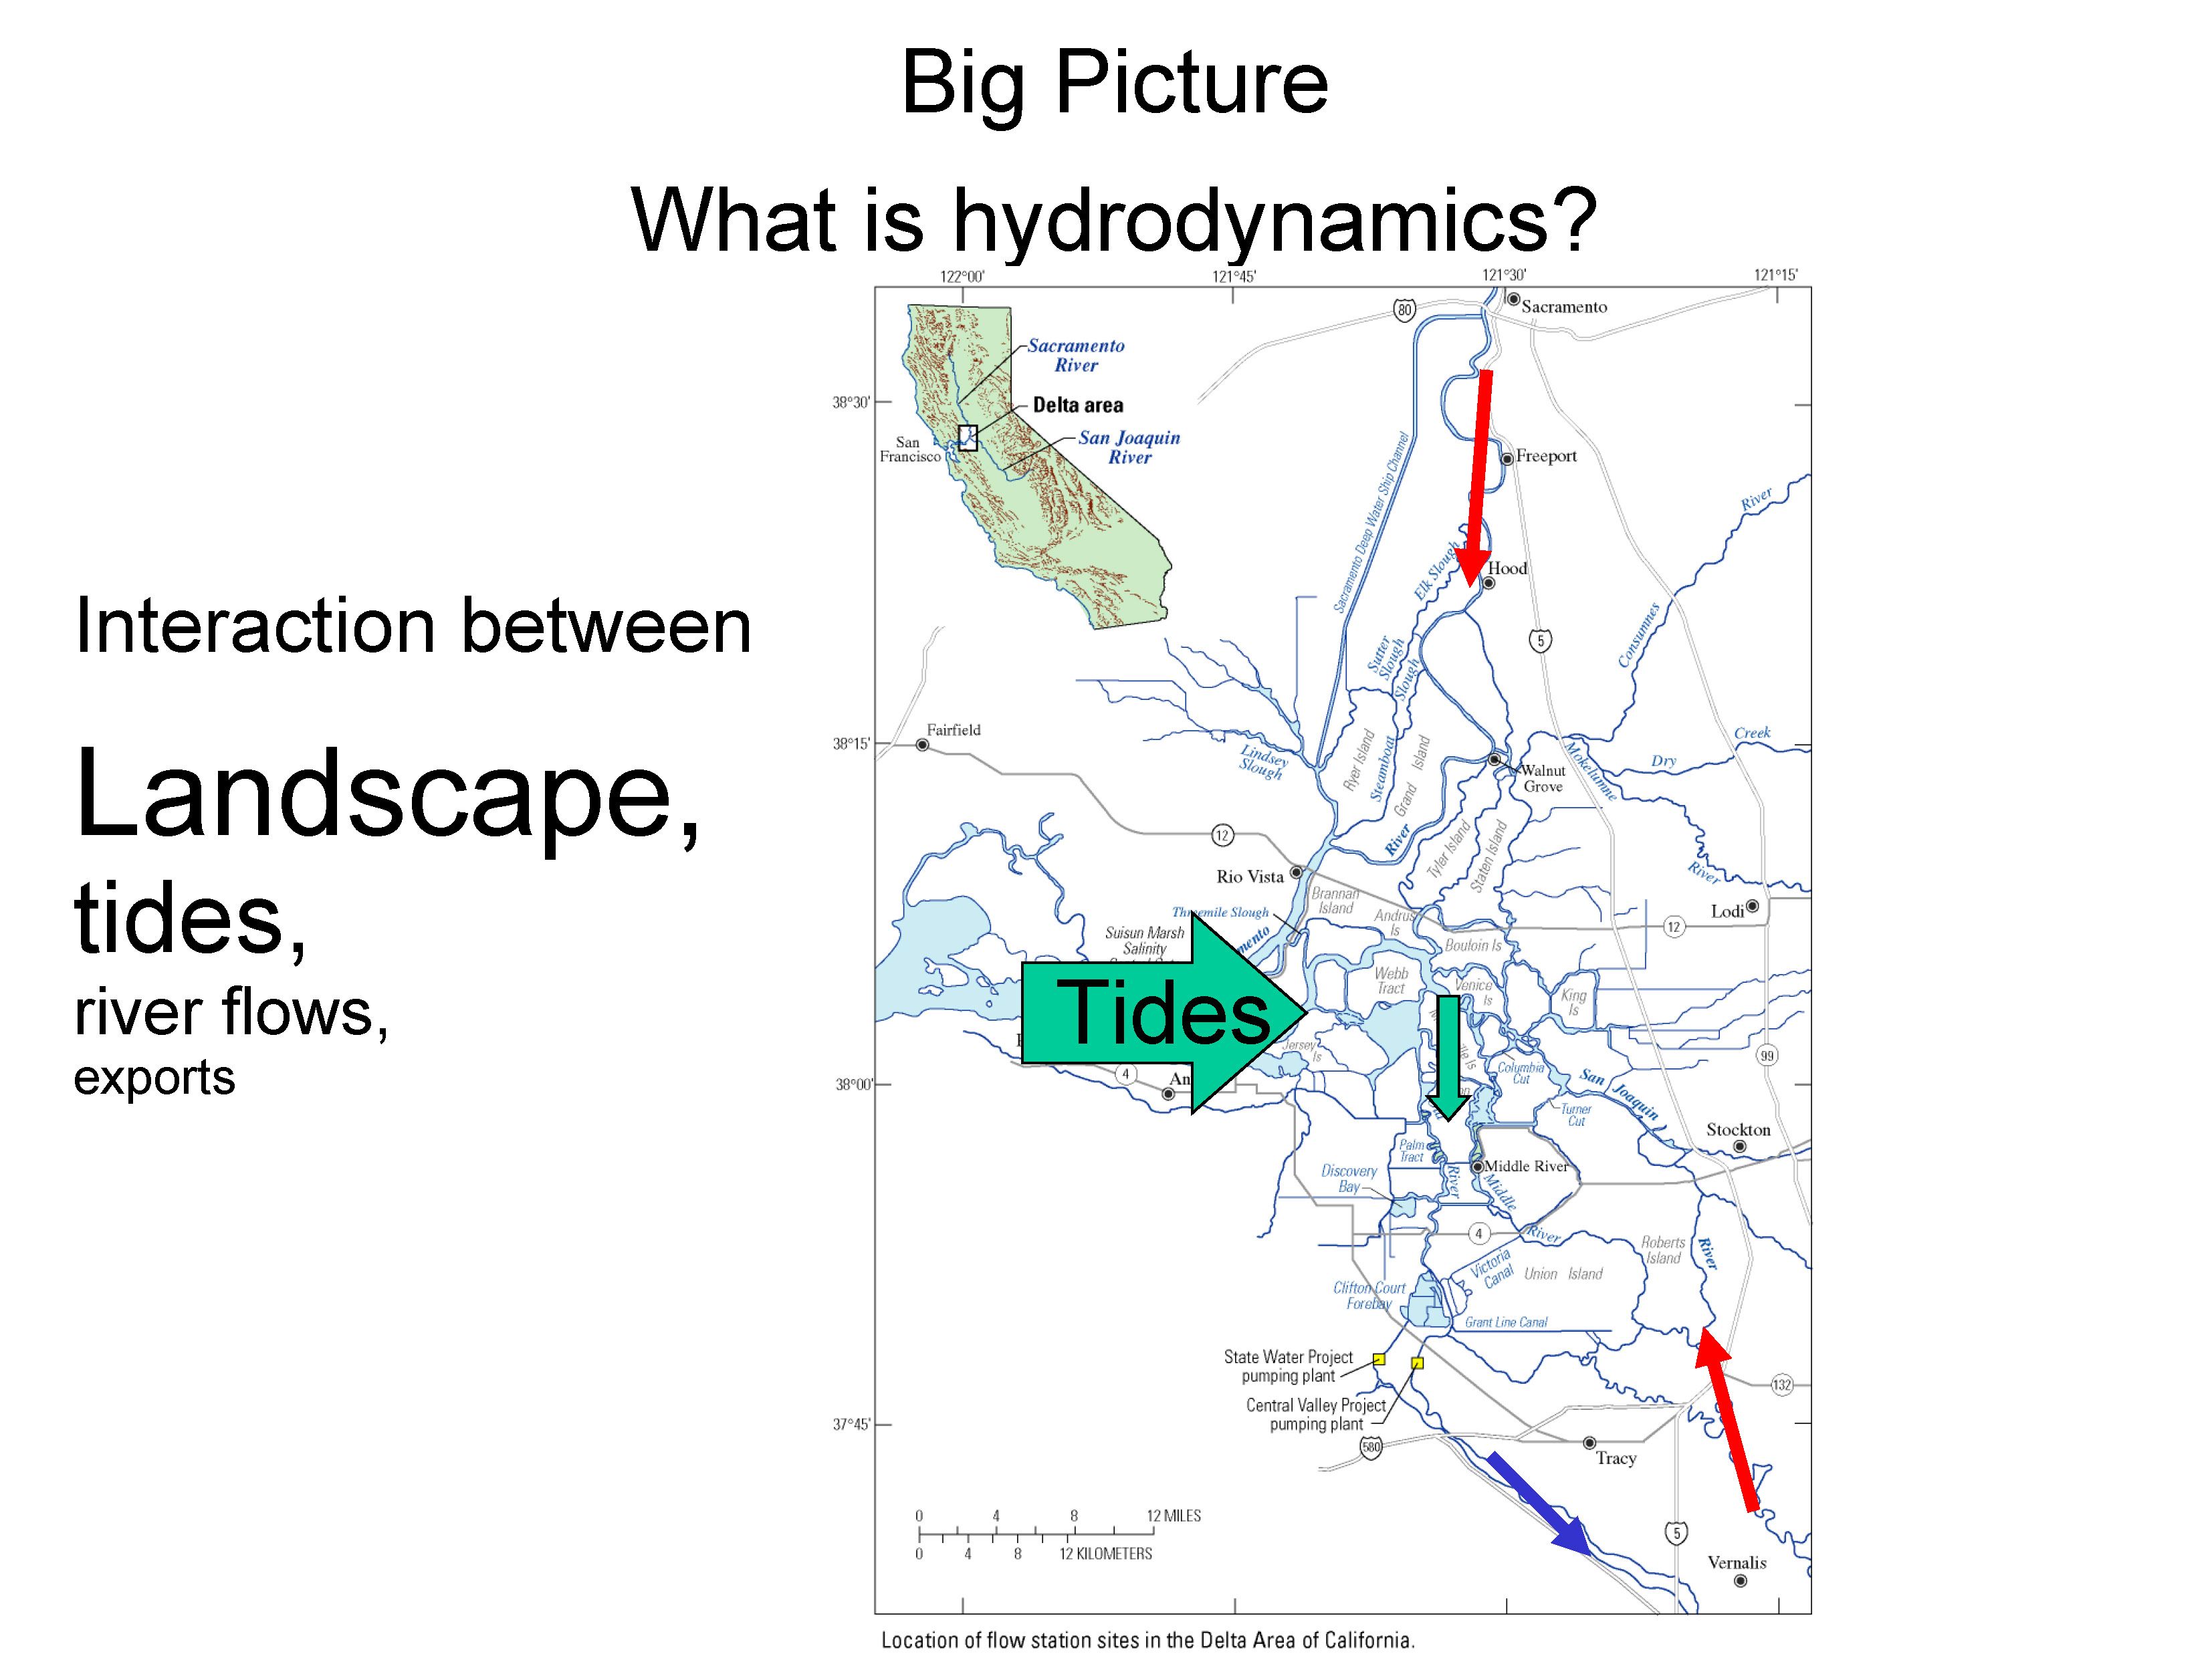 What are hydrodynamics? He presented a picture of the Delta, noting the scale of the text. “We do have river flows (the red arrows), we have exports (the blue arrows), and we have this big thing with the tides,” he said. “Obviously all of those – landscape, tides, river flows, and exports are very important locally and regionally, but when you think about the entire Delta, the landscape is one of the biggest things that can change the hydrodynamics. So I would argue that in particular, if a lot of this restoration occurs, that will have a larger impact overall on the Delta than exports, tunnels, and those kinds of things.”
 “There are a few things that hydrodynamics do that make it difficult for us to figure out what’s going on,” he said. “The first thing it does is connect aquatic landscapes over local, regional, and larger time scales, and then the other thing is that it really messes us up. Stuff moves all over the place, the tides are really important, and so there’s a lot of high-frequency variability in almost everything we can collect. What we’re most interested in is long-term trends and how things are happening in longer term time scales, but this high frequency stuff always gets in the way. It’s a big challenge.”
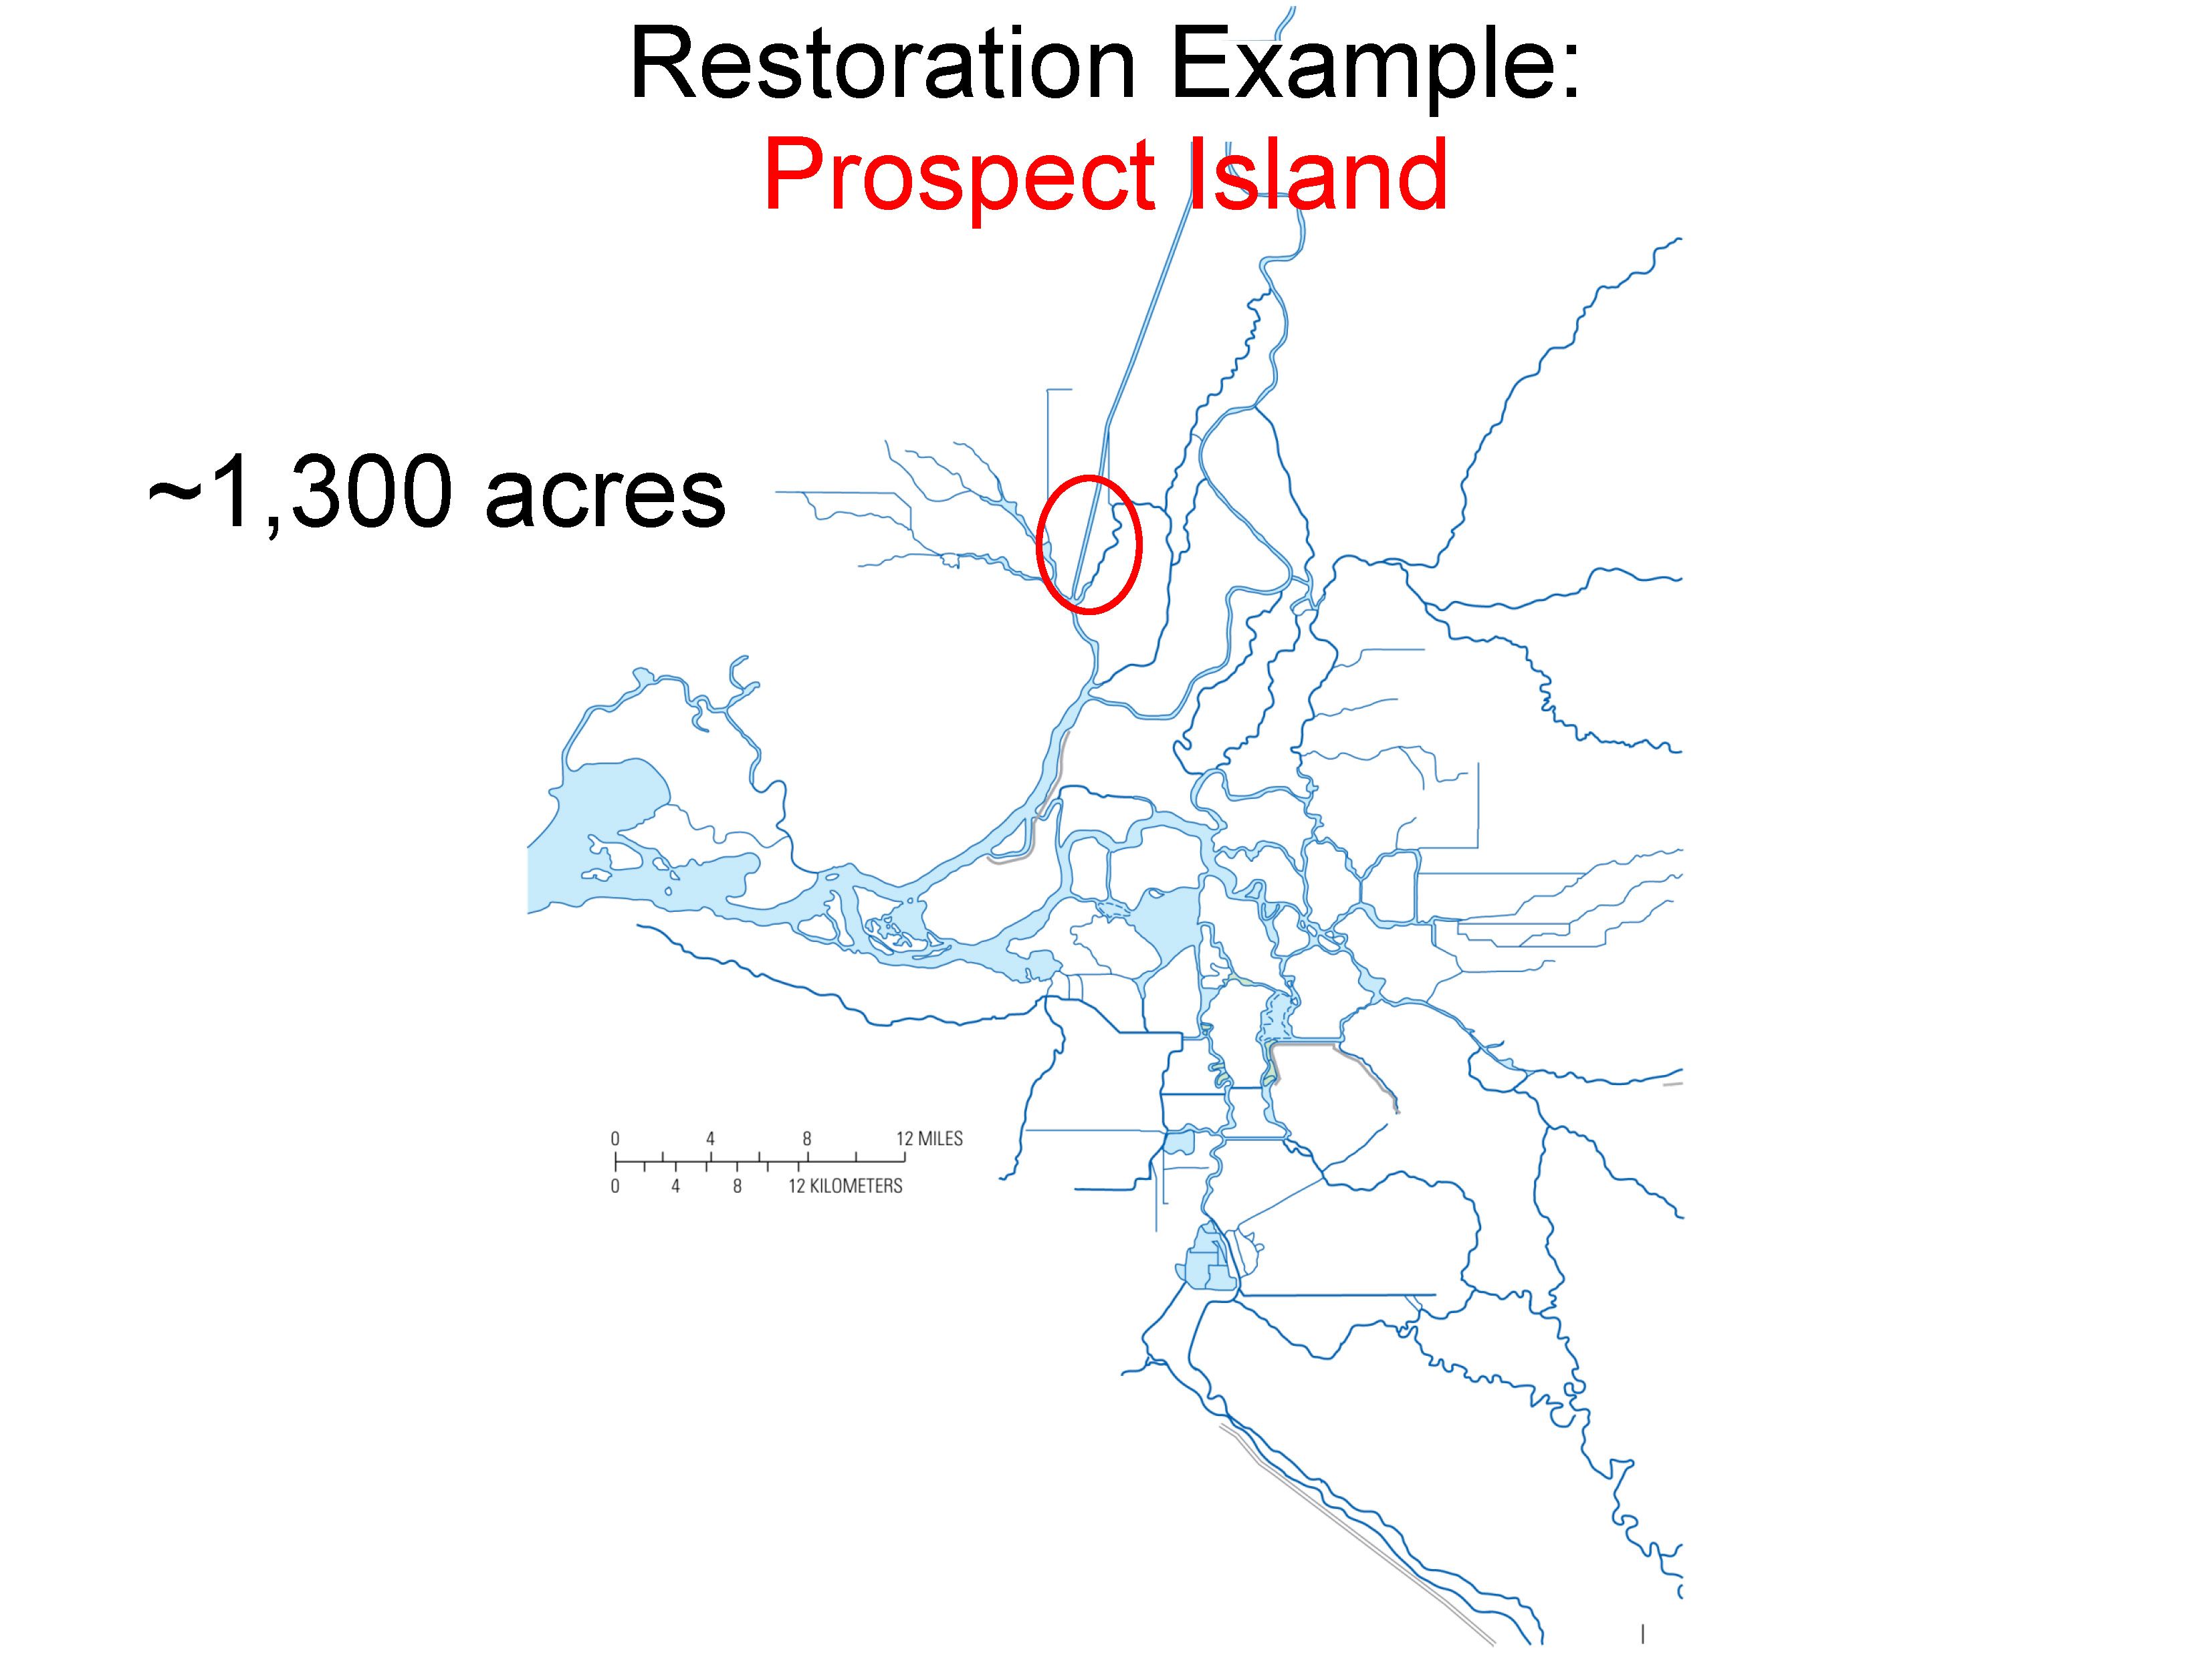
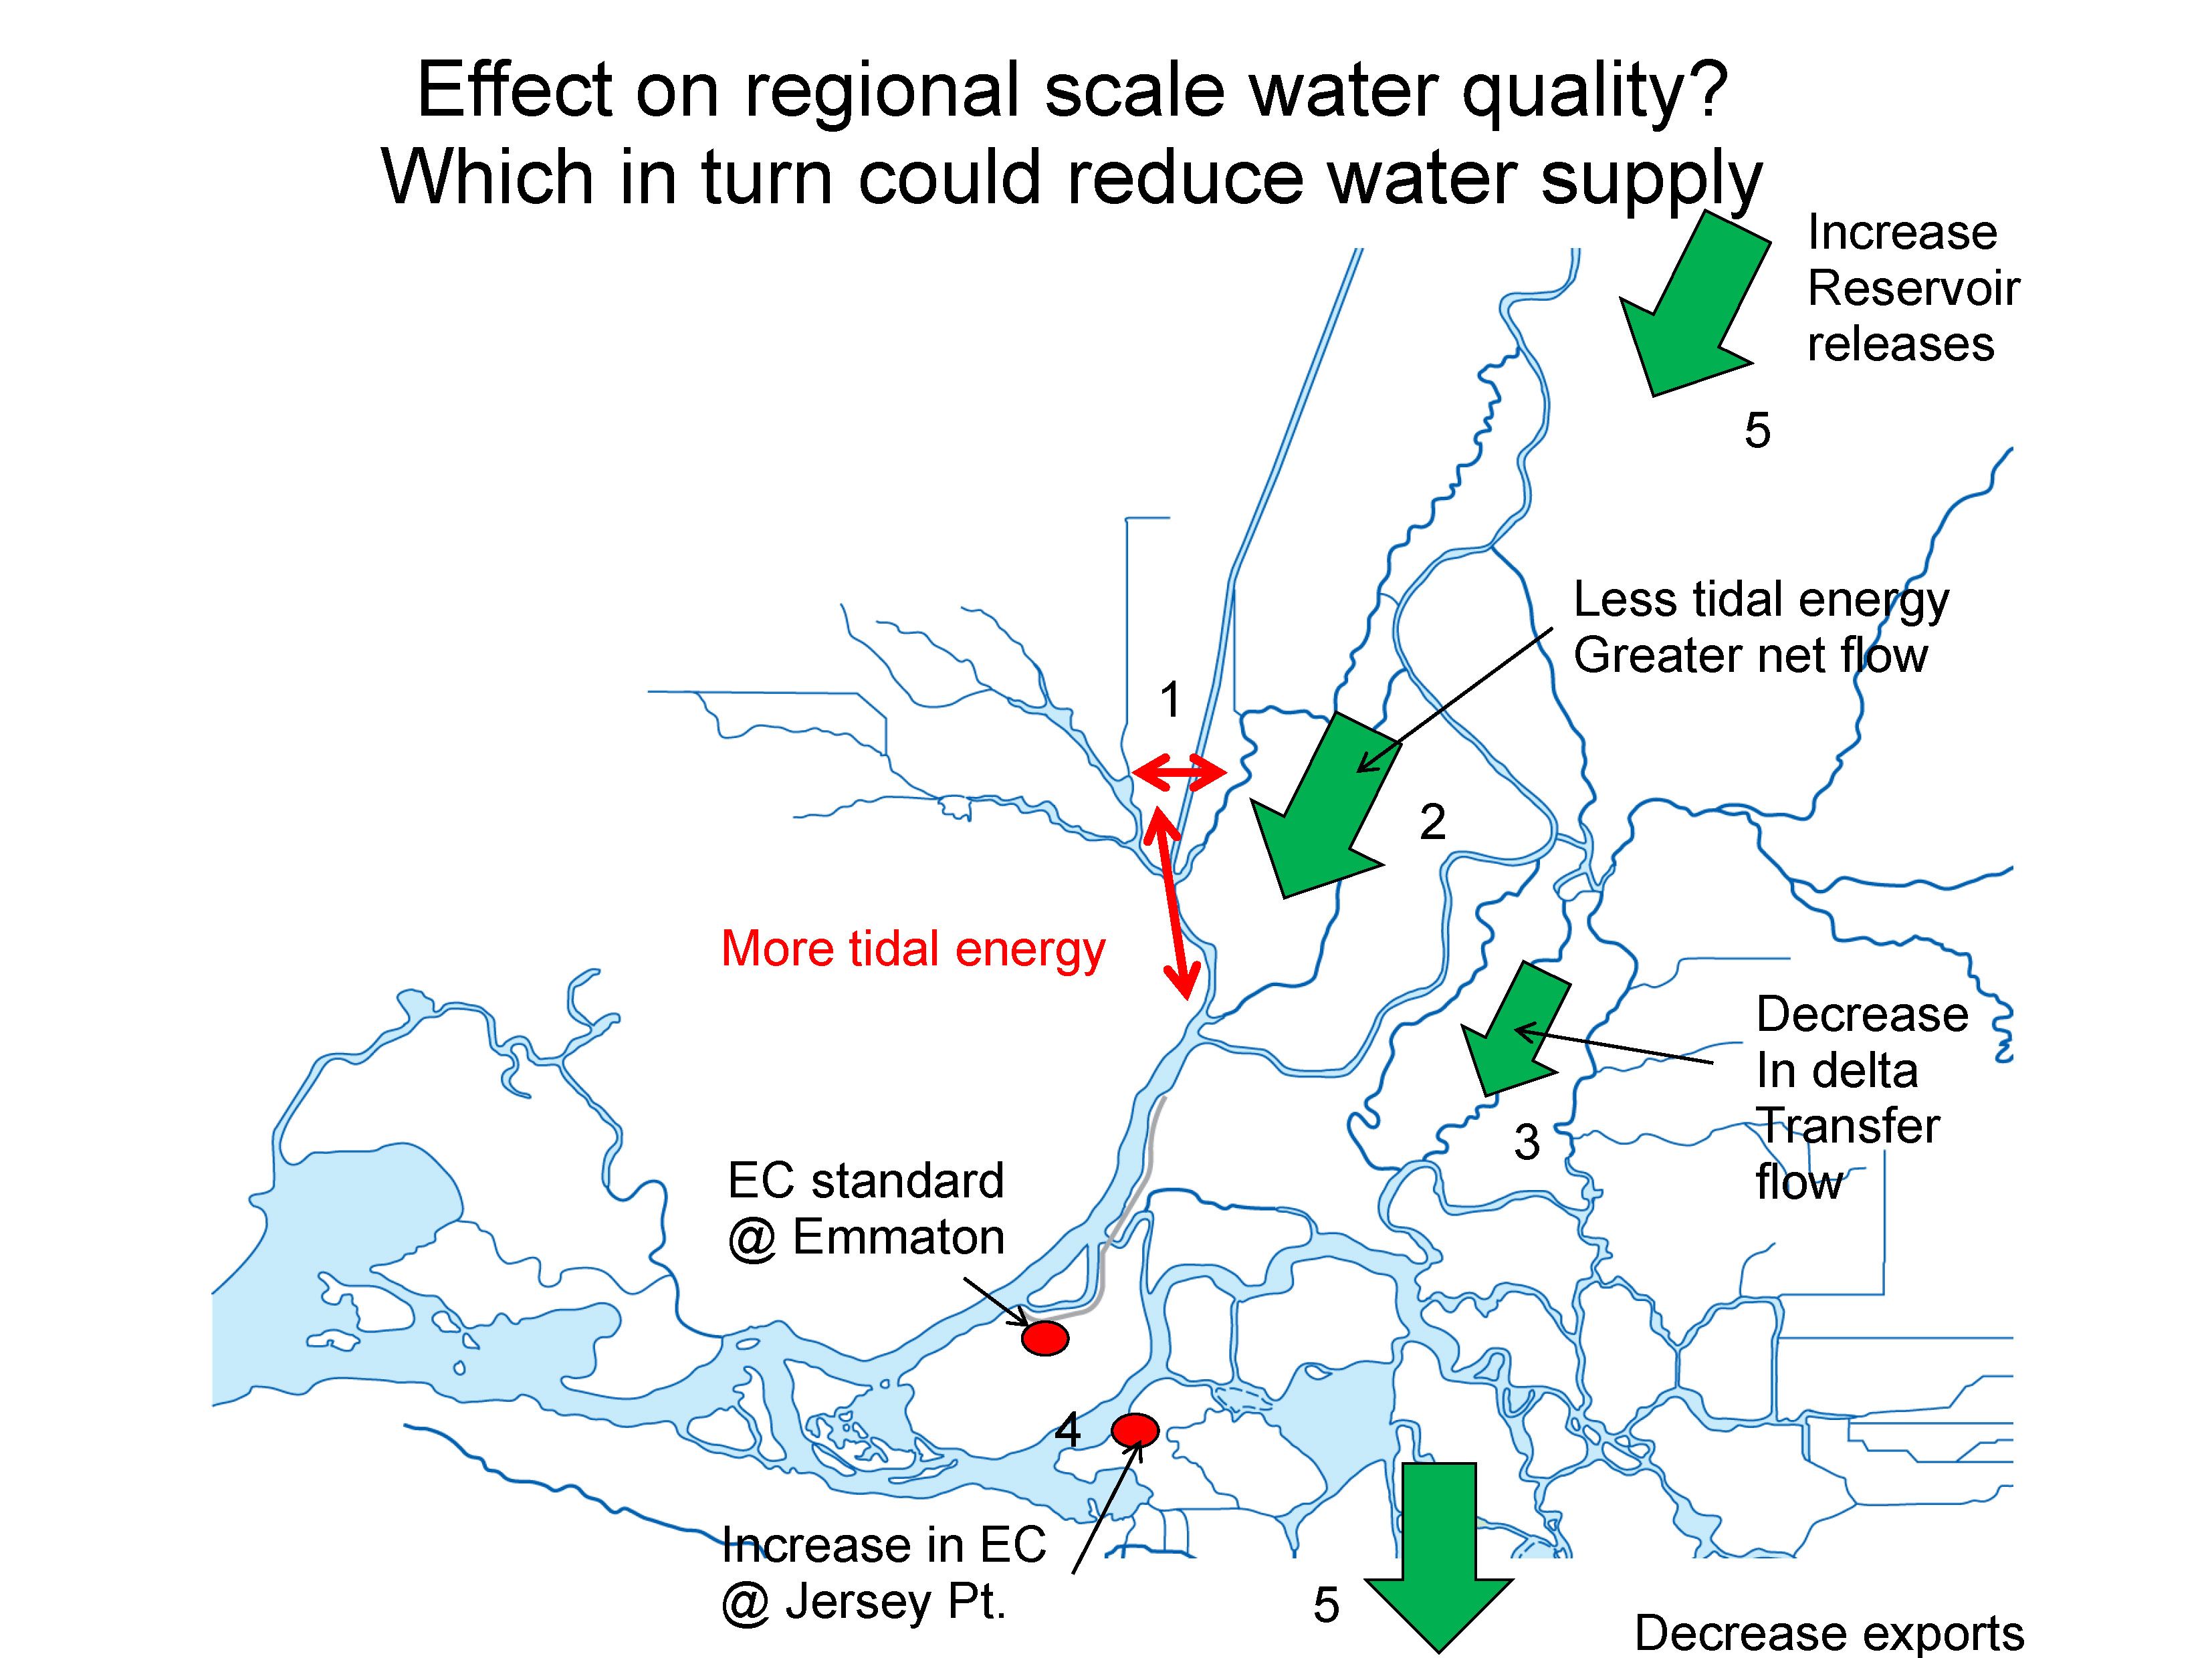 Mr. Burau then gave the example of Prospect Island and how a relatively small change in one place can change regional hydrodynamics. “What we’re learning from our models and other things is that when you do something like restore Prospect Island, it affects things regionally … when you open this up, it’s going to increase the tidal energy, and it will probably affect water quality. If it does that, in order for them to maintain salinity standards, they have to either release more water or decrease exports, so here I’ve done my little Prospect Island thing, but I’ve affected everything from salt transport to exports, so when we think about collecting data and analyzing it, we can’t just look at Prospect Island when we do our research. We have to look at how it affects everything. That is something that is very challenging.”
Mr. Burau said there were about a half dozen examples on how a simple restoration in one area can affect hydrodynamics everywhere. “Then the real challenge is that when you do something to Prospect Island, something to Liberty Island, you put in the isolated facility, or a levee fails, and then try to figure out how the ecosystem is functioning when all of those things are happening is very challenging because hydrodrynamics tends to propagate things that are done at a local scale to a regional scale. So the bad news is that we have to do things on a landscape scale even when we do small scale modifications.”
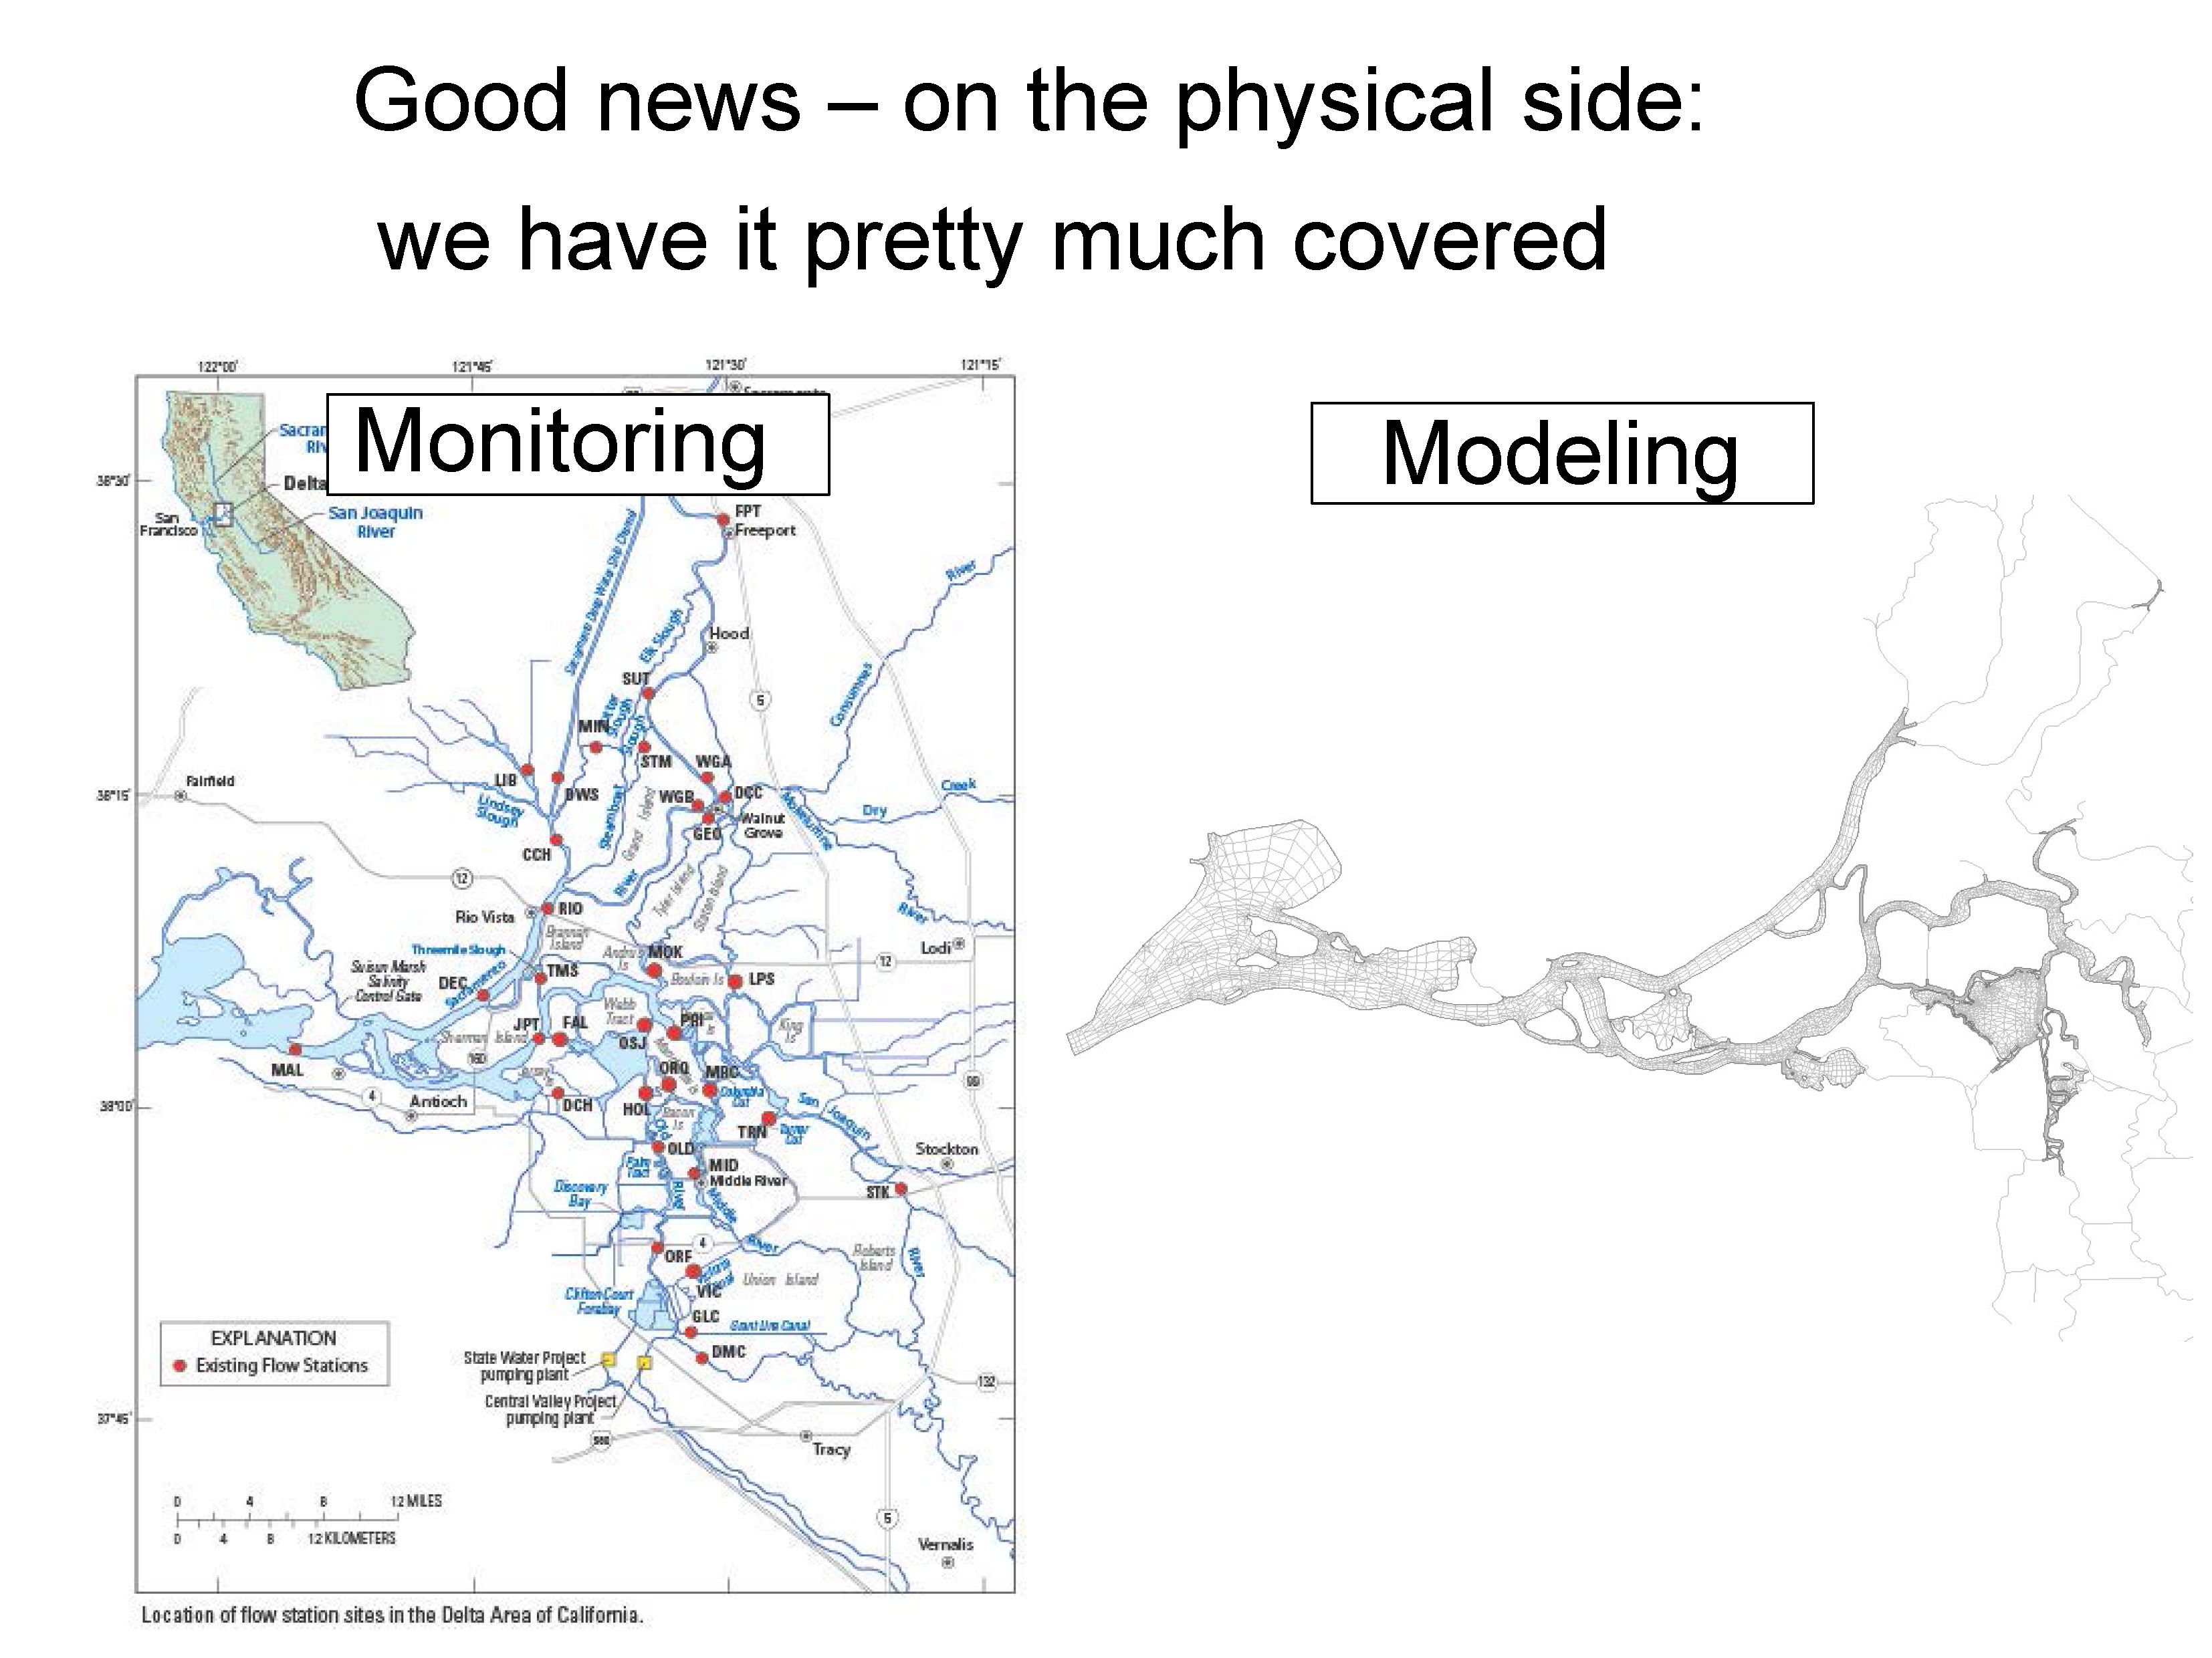 The good news is that we’re doing pretty well with hydrodynamics, he said. He presented a map showing the sampling locations, explaining that there are a lot of sampling locations to account for uncertainties and to monitor at a landscape scale to understand how changes propagate through the system. “Models have really evolved over the last 20 years, and we do have some predictive capabilities on the big picture physical things,” he said.
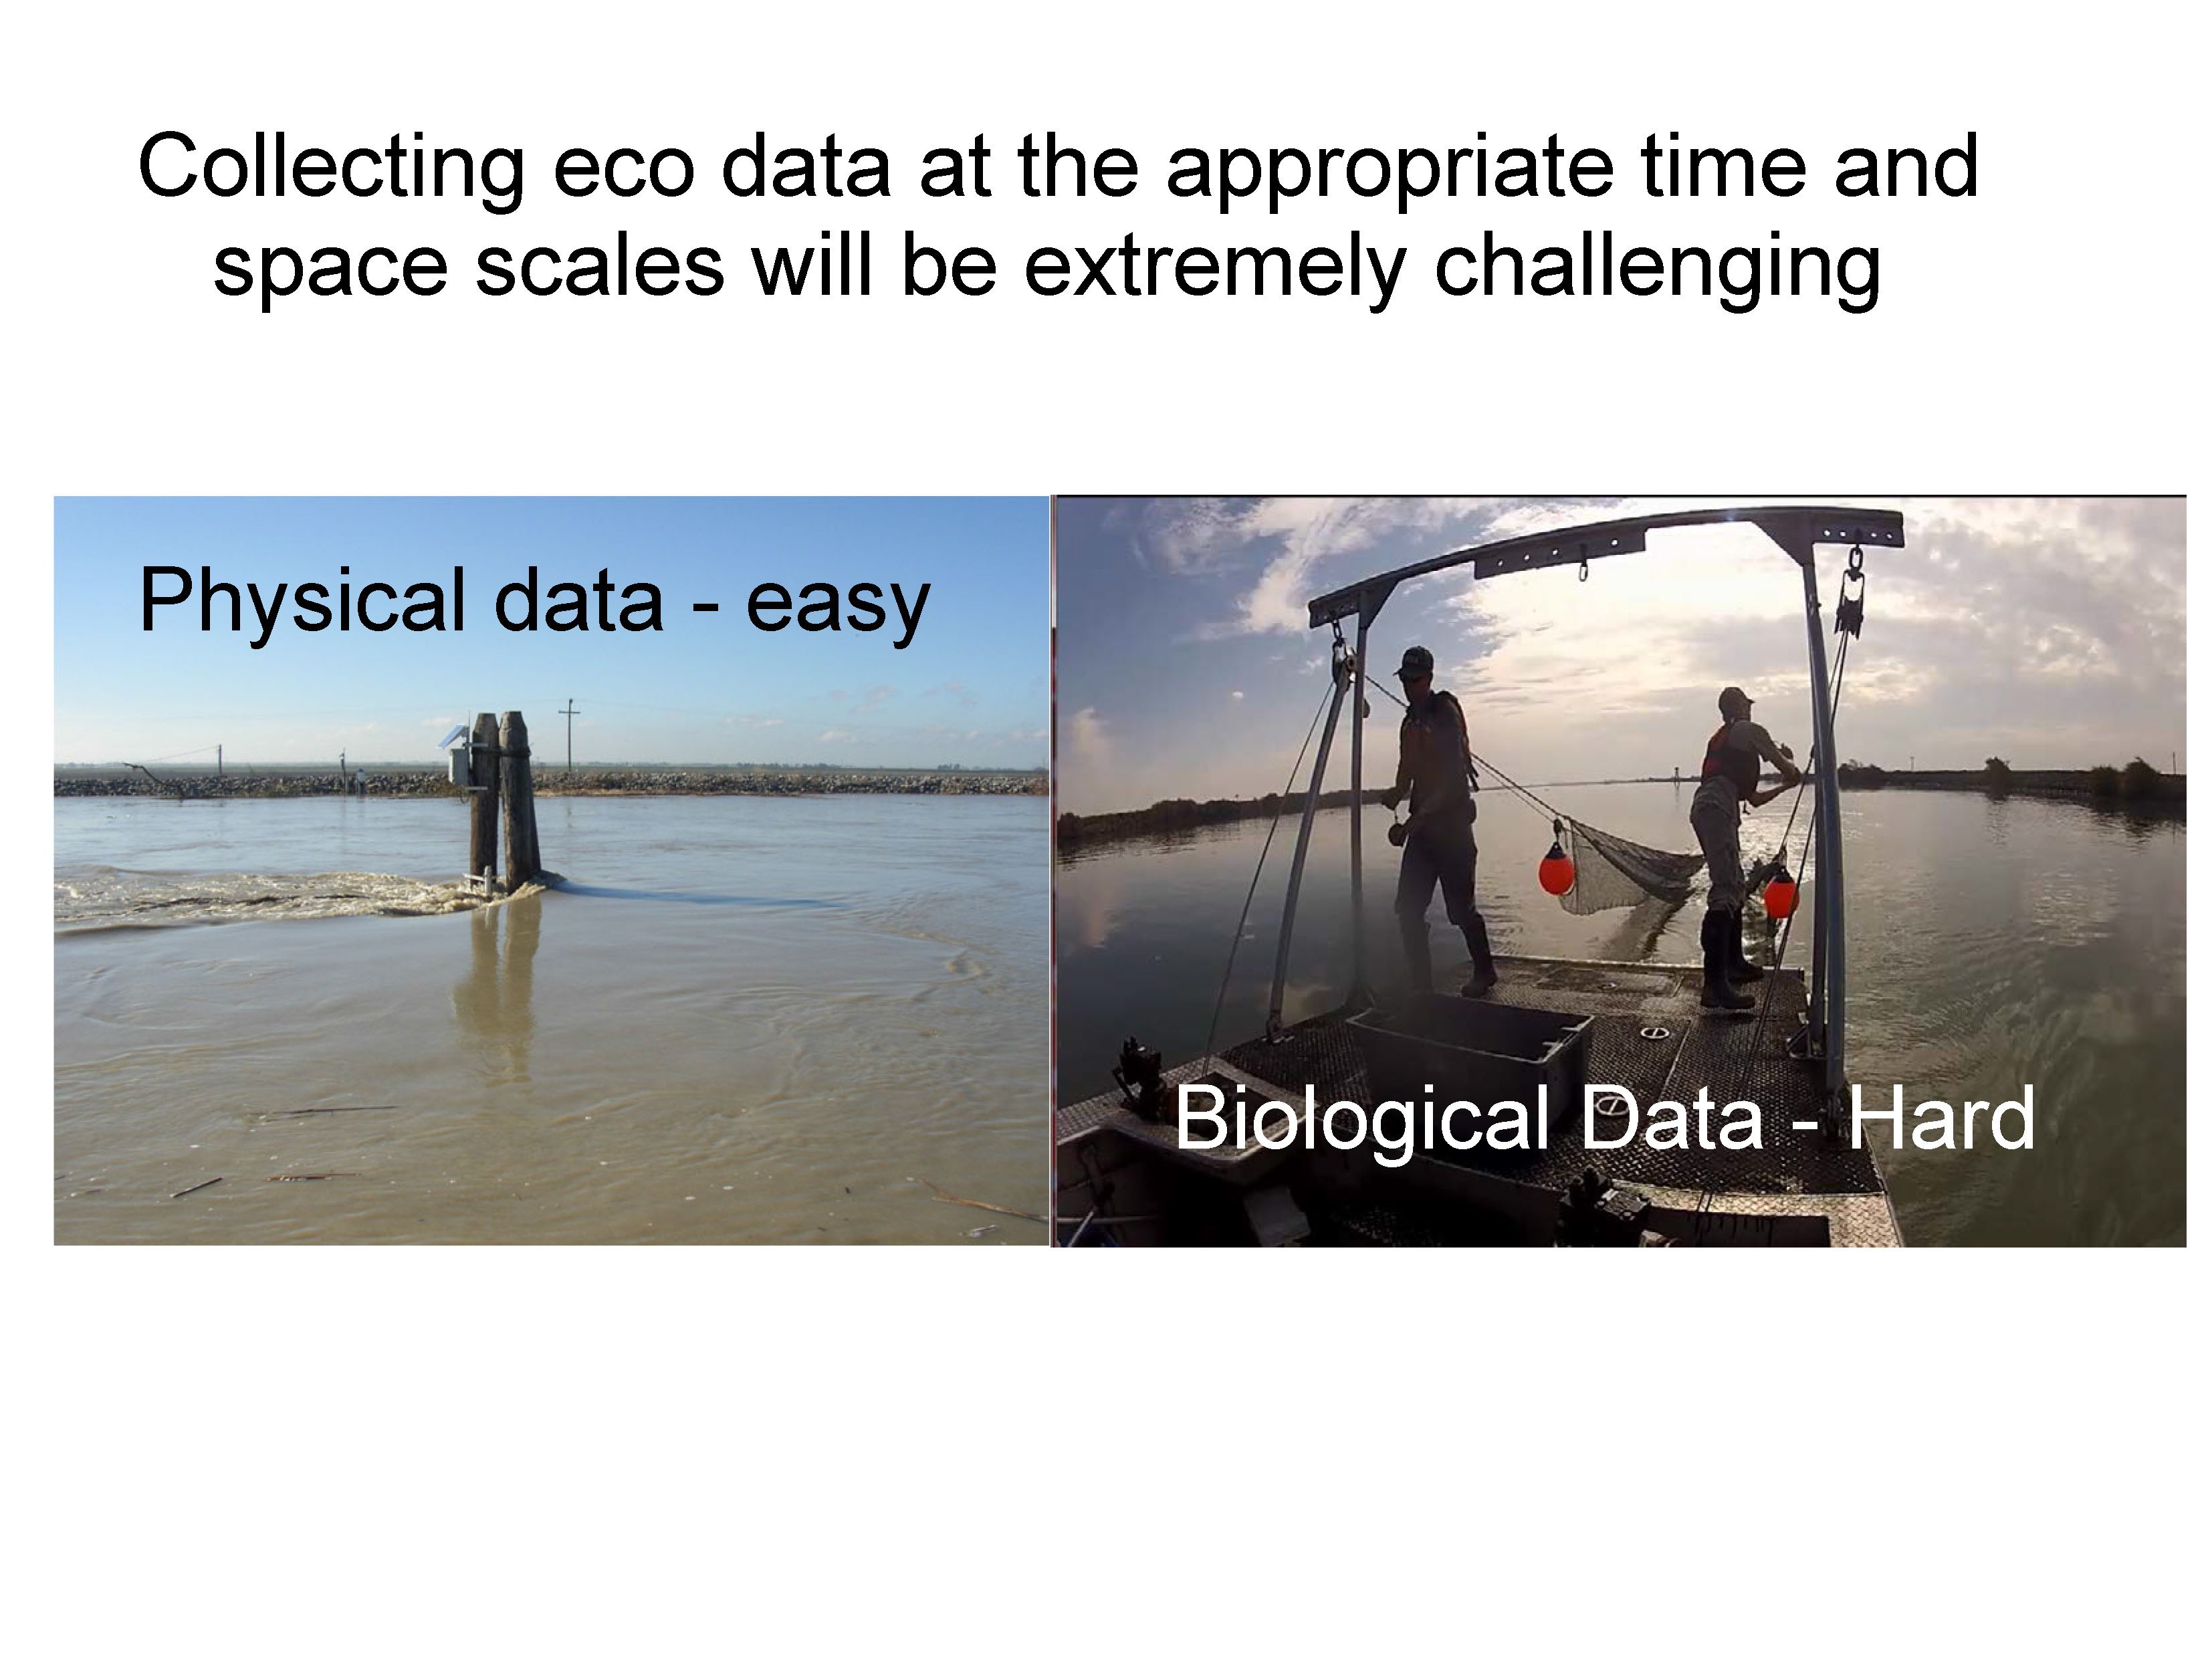
When it comes to sampling ecological variables, there is all kinds of high frequency variability that needs to be taken into account, Mr. Burau said. “The problem with that is that we can’t really collect some of these things at high frequency, so we have to figure out how to be clever about it, and I don’t know that we’ve figured out how to do that,” he said. “Biological data is hard, and this is going to be a big challenge for us when we start doing BDCP and other things … we really want to know how things are affecting the upper trophic levels, but sampling at landscape scale and sampling at the correct frequencies to be able to figure out the impacts of what we’re doing is going to be very challenging.”
 “One of the things that I’ve learned by scaling up our physical monitoring from ten stations to forty, is that we do things completely differently now,” he said. “When you scale up, it’s an entirely different problem. … For us to be able to collect data to understand some of the BDCP actions, we have to scale up our ecological and biological sampling, and that’s going to be very challenging and I think that’s something we need to work on now.”
“From my perspective, we really need to get this decision support system on the ecological and biological side of our sampling house so we can figure out what happened and why, and it’s because of the hydrodynamics that we need to do it, if we can, at the highest frequencies we can afford and over regional scales,” Mr. Burau concluded.
GREG GARTRELL, Independent Consultant, Contra Costa Water District (retired)
Salinity and diversions
Greg Gartrell began his presentation with the quote from H. L. Mencken, ‘“For every complex problem, there is an answer that is clear, simple and wrong.’ “It’s from a book I’m reading on quantum theory, and I liked it so much, I thought it’d be appropriate here, but unfortunately, I think he got one thing wrong, which is that the clear, simple, wrong answer is not unique, there are lots of them, and that’s the trouble we find ourselves in with the situation that we have right now,” he said.
 He then listed some of the things we do well. “I agree that hydrodynamics, salinity movement, and dispersion are things that we understand quite well,” he said. “We’re good at local measurements of salinity, temperature, turbidity and flow.”
Mr. Gartrell said that we’re also good at modeling flows, water stage or surface elevation for given inflows, diversions, and tides. “Modeling salinity transport for give flow conditions, we’re very good at that,” he said.
There are some things we could do but don’t that are important, he said. “We’re very poor at measuring local diversions. There are a lot of them in the Delta and upstream, and if you keep track people of what people have to deal with every day, in the summer releasing water from a dam upstream and not having it show up in the Delta and not knowing why. We’ve looked at some of those reasons and they are not just simple reasons; there’s a lot of things going on. But when you get into the Delta, very few diversions are measures and even fewer are reported in real-time.”
“The vast majority of discharges off of Delta islands are not measured, in terms of volume or quality, and those all affect local salinity issues and pollution issues and make it very, very difficult to determine what’s going on,” he said. “And there are things like wind shear, atmospheric pressure, and bathymetry changes that need to be tracked and to do modeling of past situations, and we don’t do a real good job of keeping track of all of those.”
One of the things we can’t do is predict the effects of sea level rise, Mr. Gartrell said. “It’s wrong to say that sea level is going to make salinity rise without knowing what the response to that is,” he said. “Just today, I could flood certain areas and the Delta and make salinity go down, and other areas in the Delta, it would make salinity go up. It depends on complex hydrodynamics that generally have to do with the phase.”
“For example, islands flooded in the western delta are close enough to be in phase with the flood tide coming through the Carquinez Straits that they will enhance the amount of the flow coming, whereas if you get up into the northern part of the Delta, or the eastern or the southern, you’re out of phase,” he said. “Sacramento, compared to the Golden Gate is about 7 to 9 hours out of phase, and higher in the tide than the Golden Gate, so it’s rising when the Golden Gate is going down, and that can have the opposite effect; if you have one area that’s ebbing when another area is flooding, it reduces salinity entrainment.”
 The problem with sea level rise is it’s so complex, you can’t bookend it, he said. “You can bookend the actions; you can say in one case, we’ll look at doing nothing … and new areas flood, that’s one action bookend. Another action bookend is that we do everything and we don’t let one square centimeter flood that isn’t flooded now. You have two different answers to that, but that doesn’t bookend the salinity response; you only get a bookend on the salinity response if you’re system is kind enough to have a well behaved function in between those two points and it isn’t. There’s not guarantee that’s it’s monotonic; there’s no guarantee that there are maxima and minima, depending on what areas you flood and don’t flood.”
Mr. Gartrell said that recent work at UC Berkeley has demonstrated that by comparing the do everything scenario and don’t let anything flood or allowing areas to flood, vastly different levels of tidal amplitude result. “When you have different levels of tidal amplitude, you’re going to have different flows and different dispersion of salinity. In fact, some of their work is showing that if you do something in the north Bay around San Pablo Bay and don’t allow areas to flood there, you can make things dramatically worse in the south Bay and flood areas that wouldn’t have been flooded otherwise.”
Another thing we cannot do is predict climate change. “The way we look at that is use a lot of different models and then average them, hoping they don’t all have the same systematic errors,” he said. “You can get ideas, like there will be generally more rain, less snow, and more severe wet/dry periods but it’s not that good at predicting; it’s nowhere near like the advances we’ve had in weather prediction over the last 25 years.”
Mr. Gartrell said there are many examples of complexity. “Salinity flow relationships change with time but not always in the same direction and the same place because of multiple factors,” he said. “Measuring mean flow is extremely difficult and the outflow is a very important quantity, but we can’t check the measurements we have with a second method, because we don’t have all the internal measurements of all the things that are going on. Habitat restorations can have profound effects, depending on how they are done and where they are done. And you still can use complex modeling to understand them, but you still need some sort of field verification to ensure that you haven’t left something out.”
What this adds up to is that we have a general idea of what affects flows, and how salt and other dissolved pollutants will move, and we do that quite well, provided we have accurate input data, which we don’t , and to the extent we can estimate certain factors, Mr. Gartrell said. “Our forecast abilities are better than most, but still not adequate for what is needed for really developing what’s going to go on in the future and how we’re going to be able to react to that,” he concluded.
DR. JIM CLOERN
Delta challenges
Dr. Jim Cloern began by saying that his presentation would be about why solving the Delta problem is so hard.
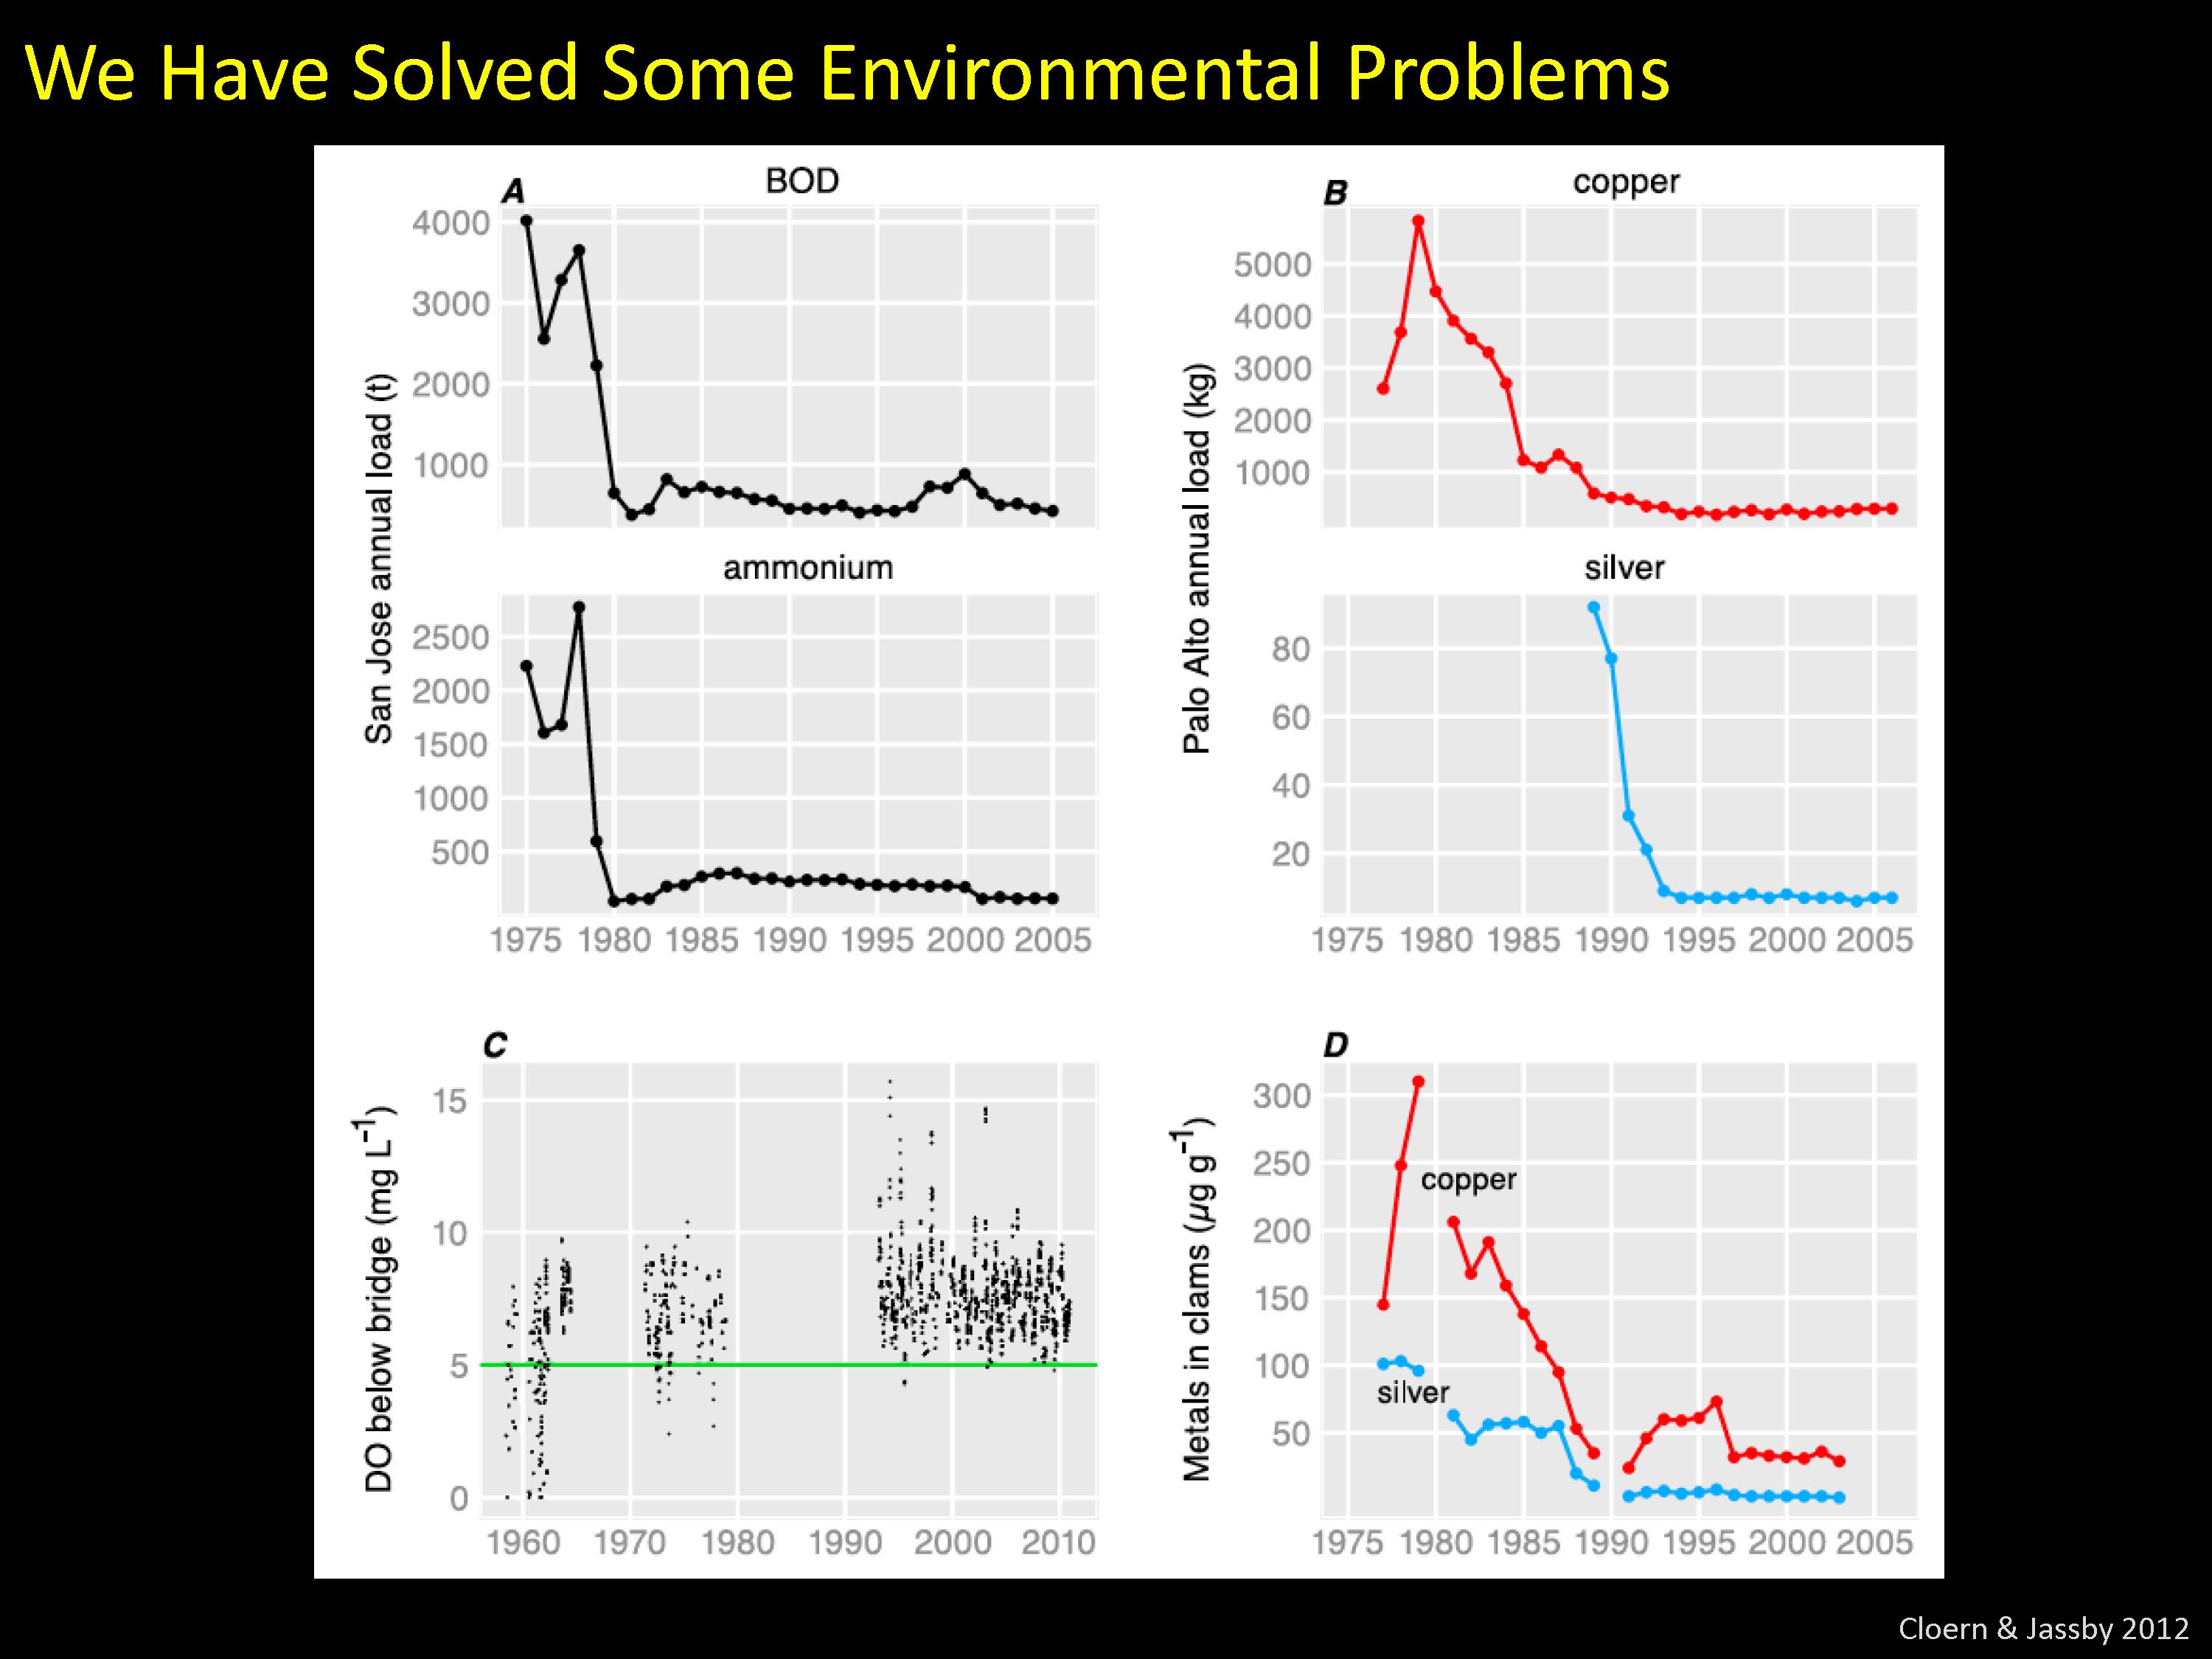 “I want to remind you that we have solved some environmental problems, and here is an example,” he said, presenting a graph showing oxygen concentrations in the lower part of San Francisco Bay in the 1950s and 1960s. “In that era, the lower south Bay was anoxic every summer. These are data from Sam Luoma showing concentrations of copper and silver in clams collected on a mudflat in the south Bay, and you can see that oxygen concentrations have gone up, metal concentrations in the clams have gone down. This is a success story in environmental management, and in this case, the problem was basically of treating sewage to a more efficient degree to remove biological oxygen demand and minerals that were discharged in wastewater effluent.”
Dr. Cloern noted that there are three attributes to this kind of problem that make us able to find the solution. “One is that we understand the problem well. Secondly, this is a local scale problem, and thirdly, there is one single factor that underlying the problem, so just a reminder that we do know how to solve some environmental problems.”
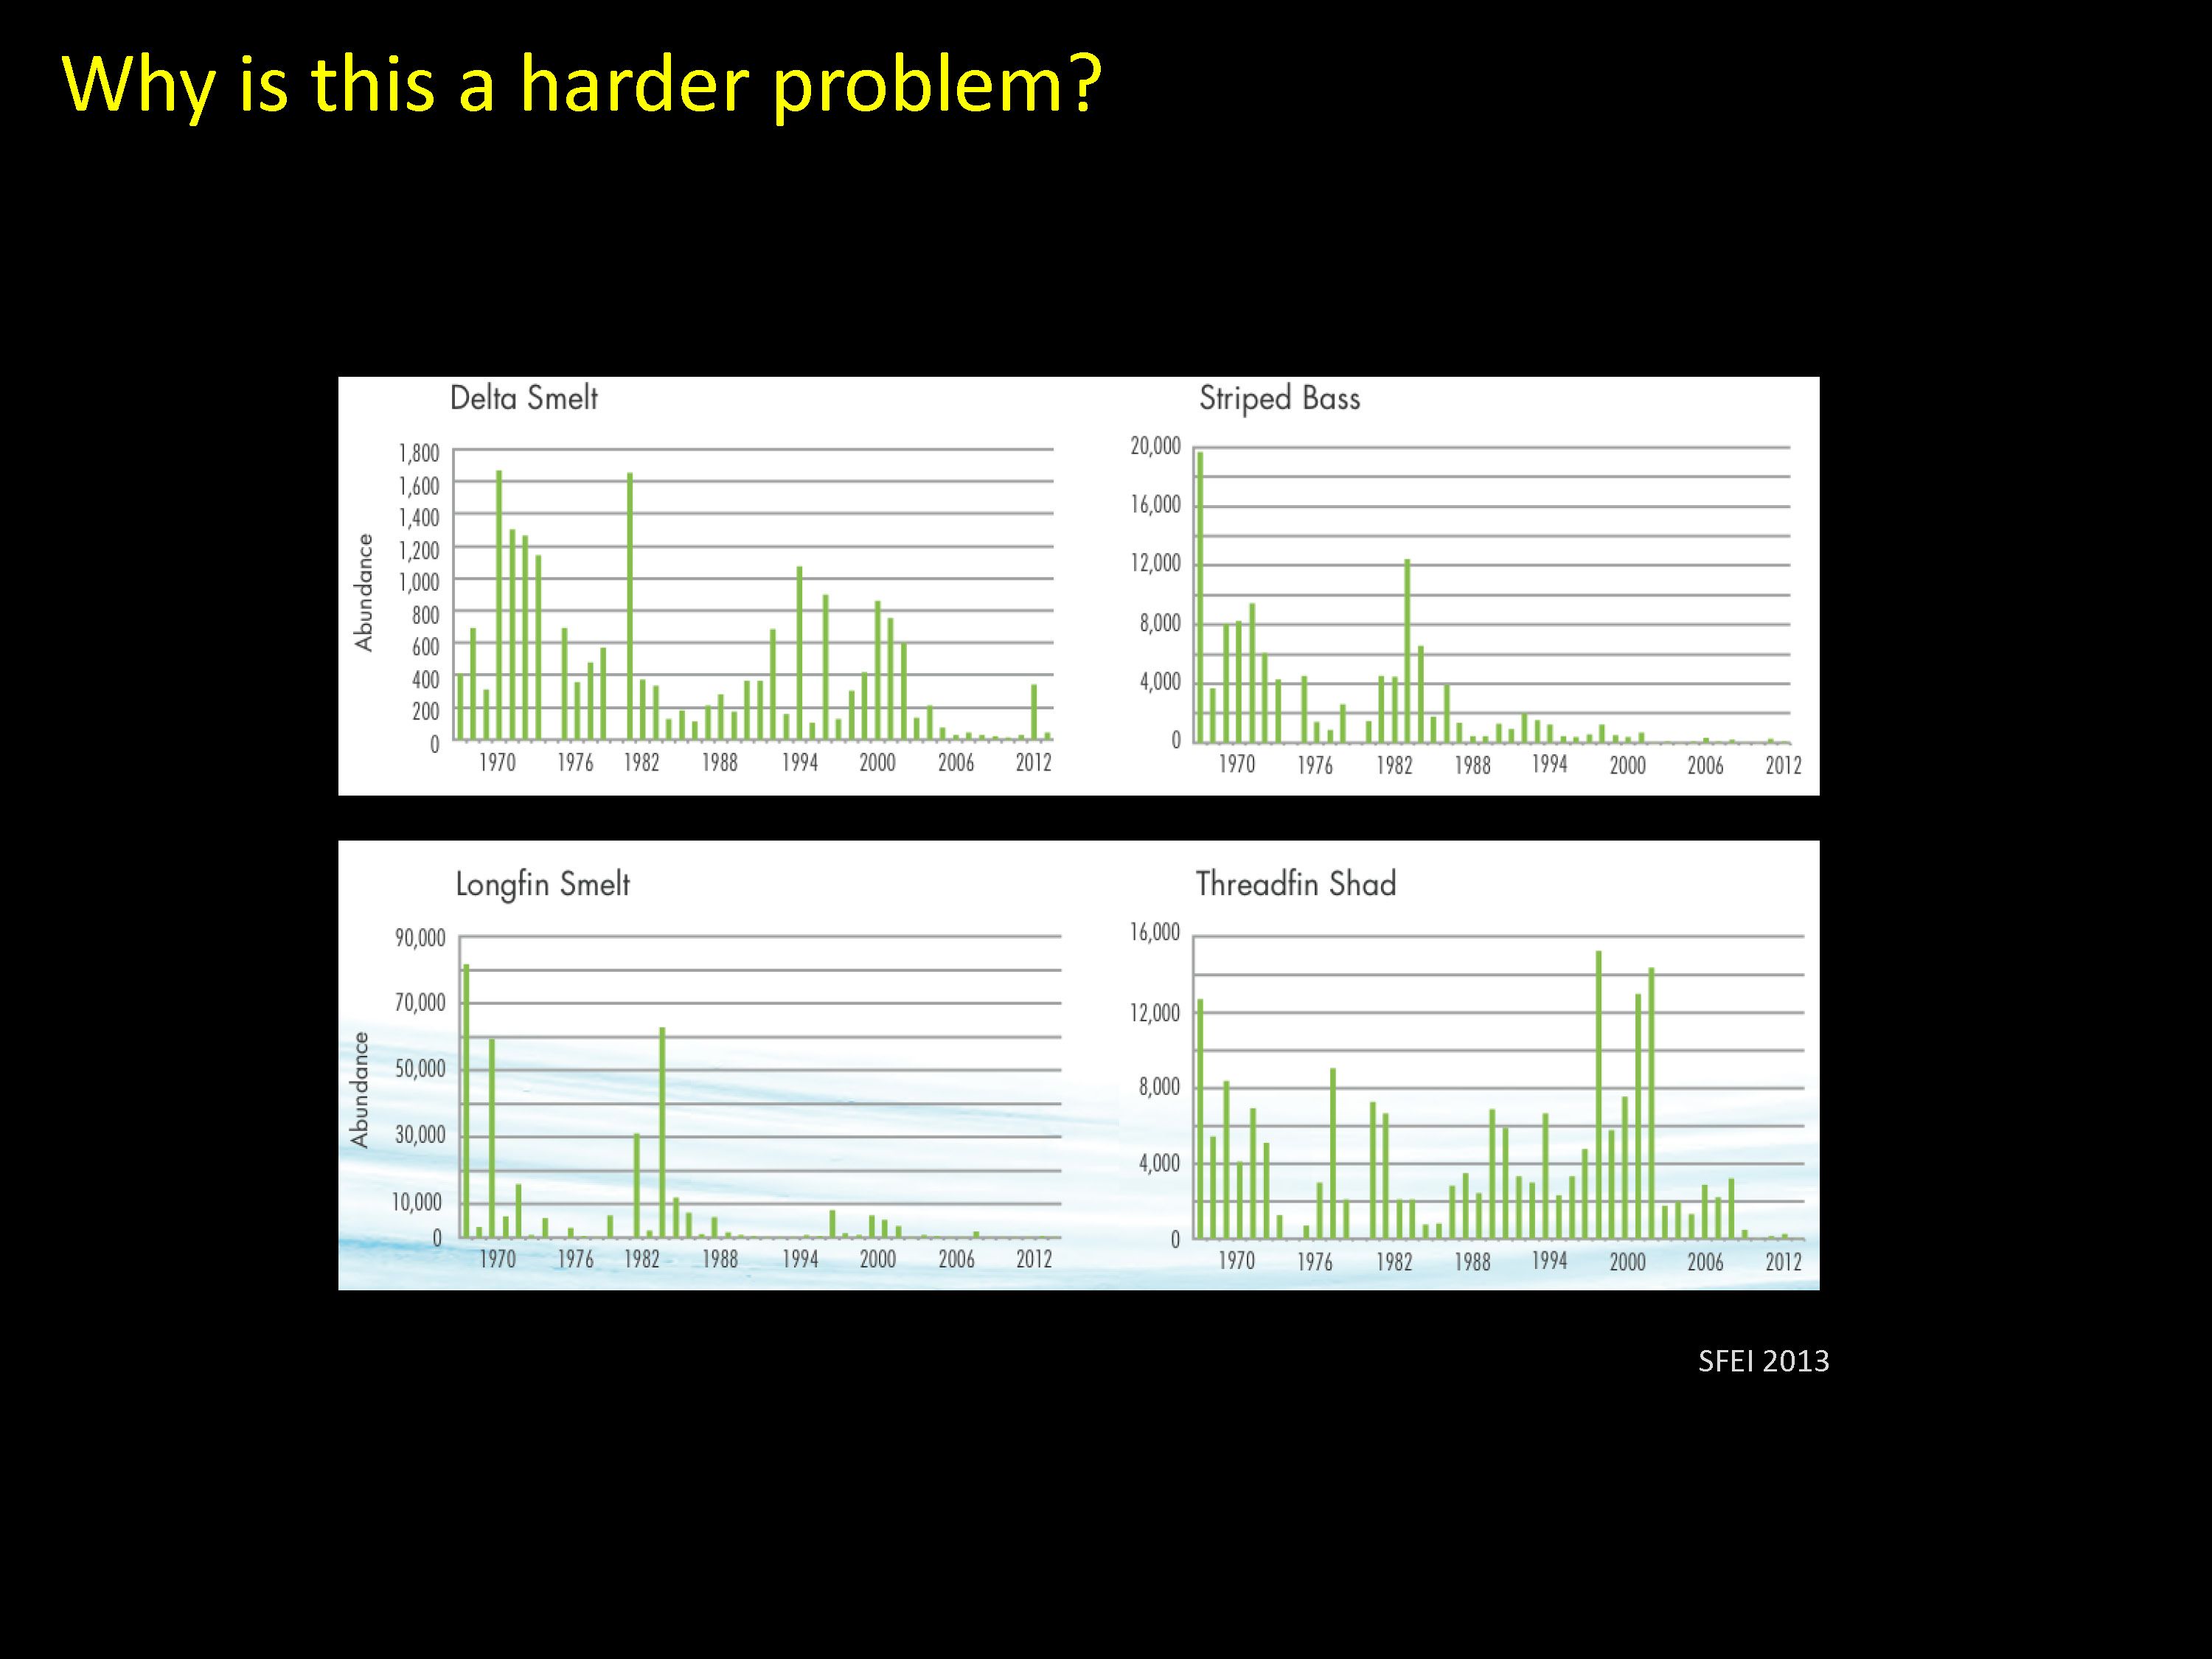 He next presented a chart showing abundance indices for Delta fish species, and said this is a different kind of problem. “The icons that we use to express indicators of the Delta problem are these population declines of the number of species of fish, but the Delta problem is not really a fish population problem,” he said. “I think it’s an ecosystem problem. These downward trajectories are indicators that the carrying capacity of the ecosystem to support these fish has diminished greatly, so in my mind, the Delta problem is what are the underlying causes that have caused the ecosystem to reduce its carrying capacity for the organisms that we want to sustain, and what steps can we take to reverse those trends.”
Dr. Cloern said he would suggest six other reasons why the Delta problem is a hard problem to make progress on.
 1-It’s a multi-dimensional problem.
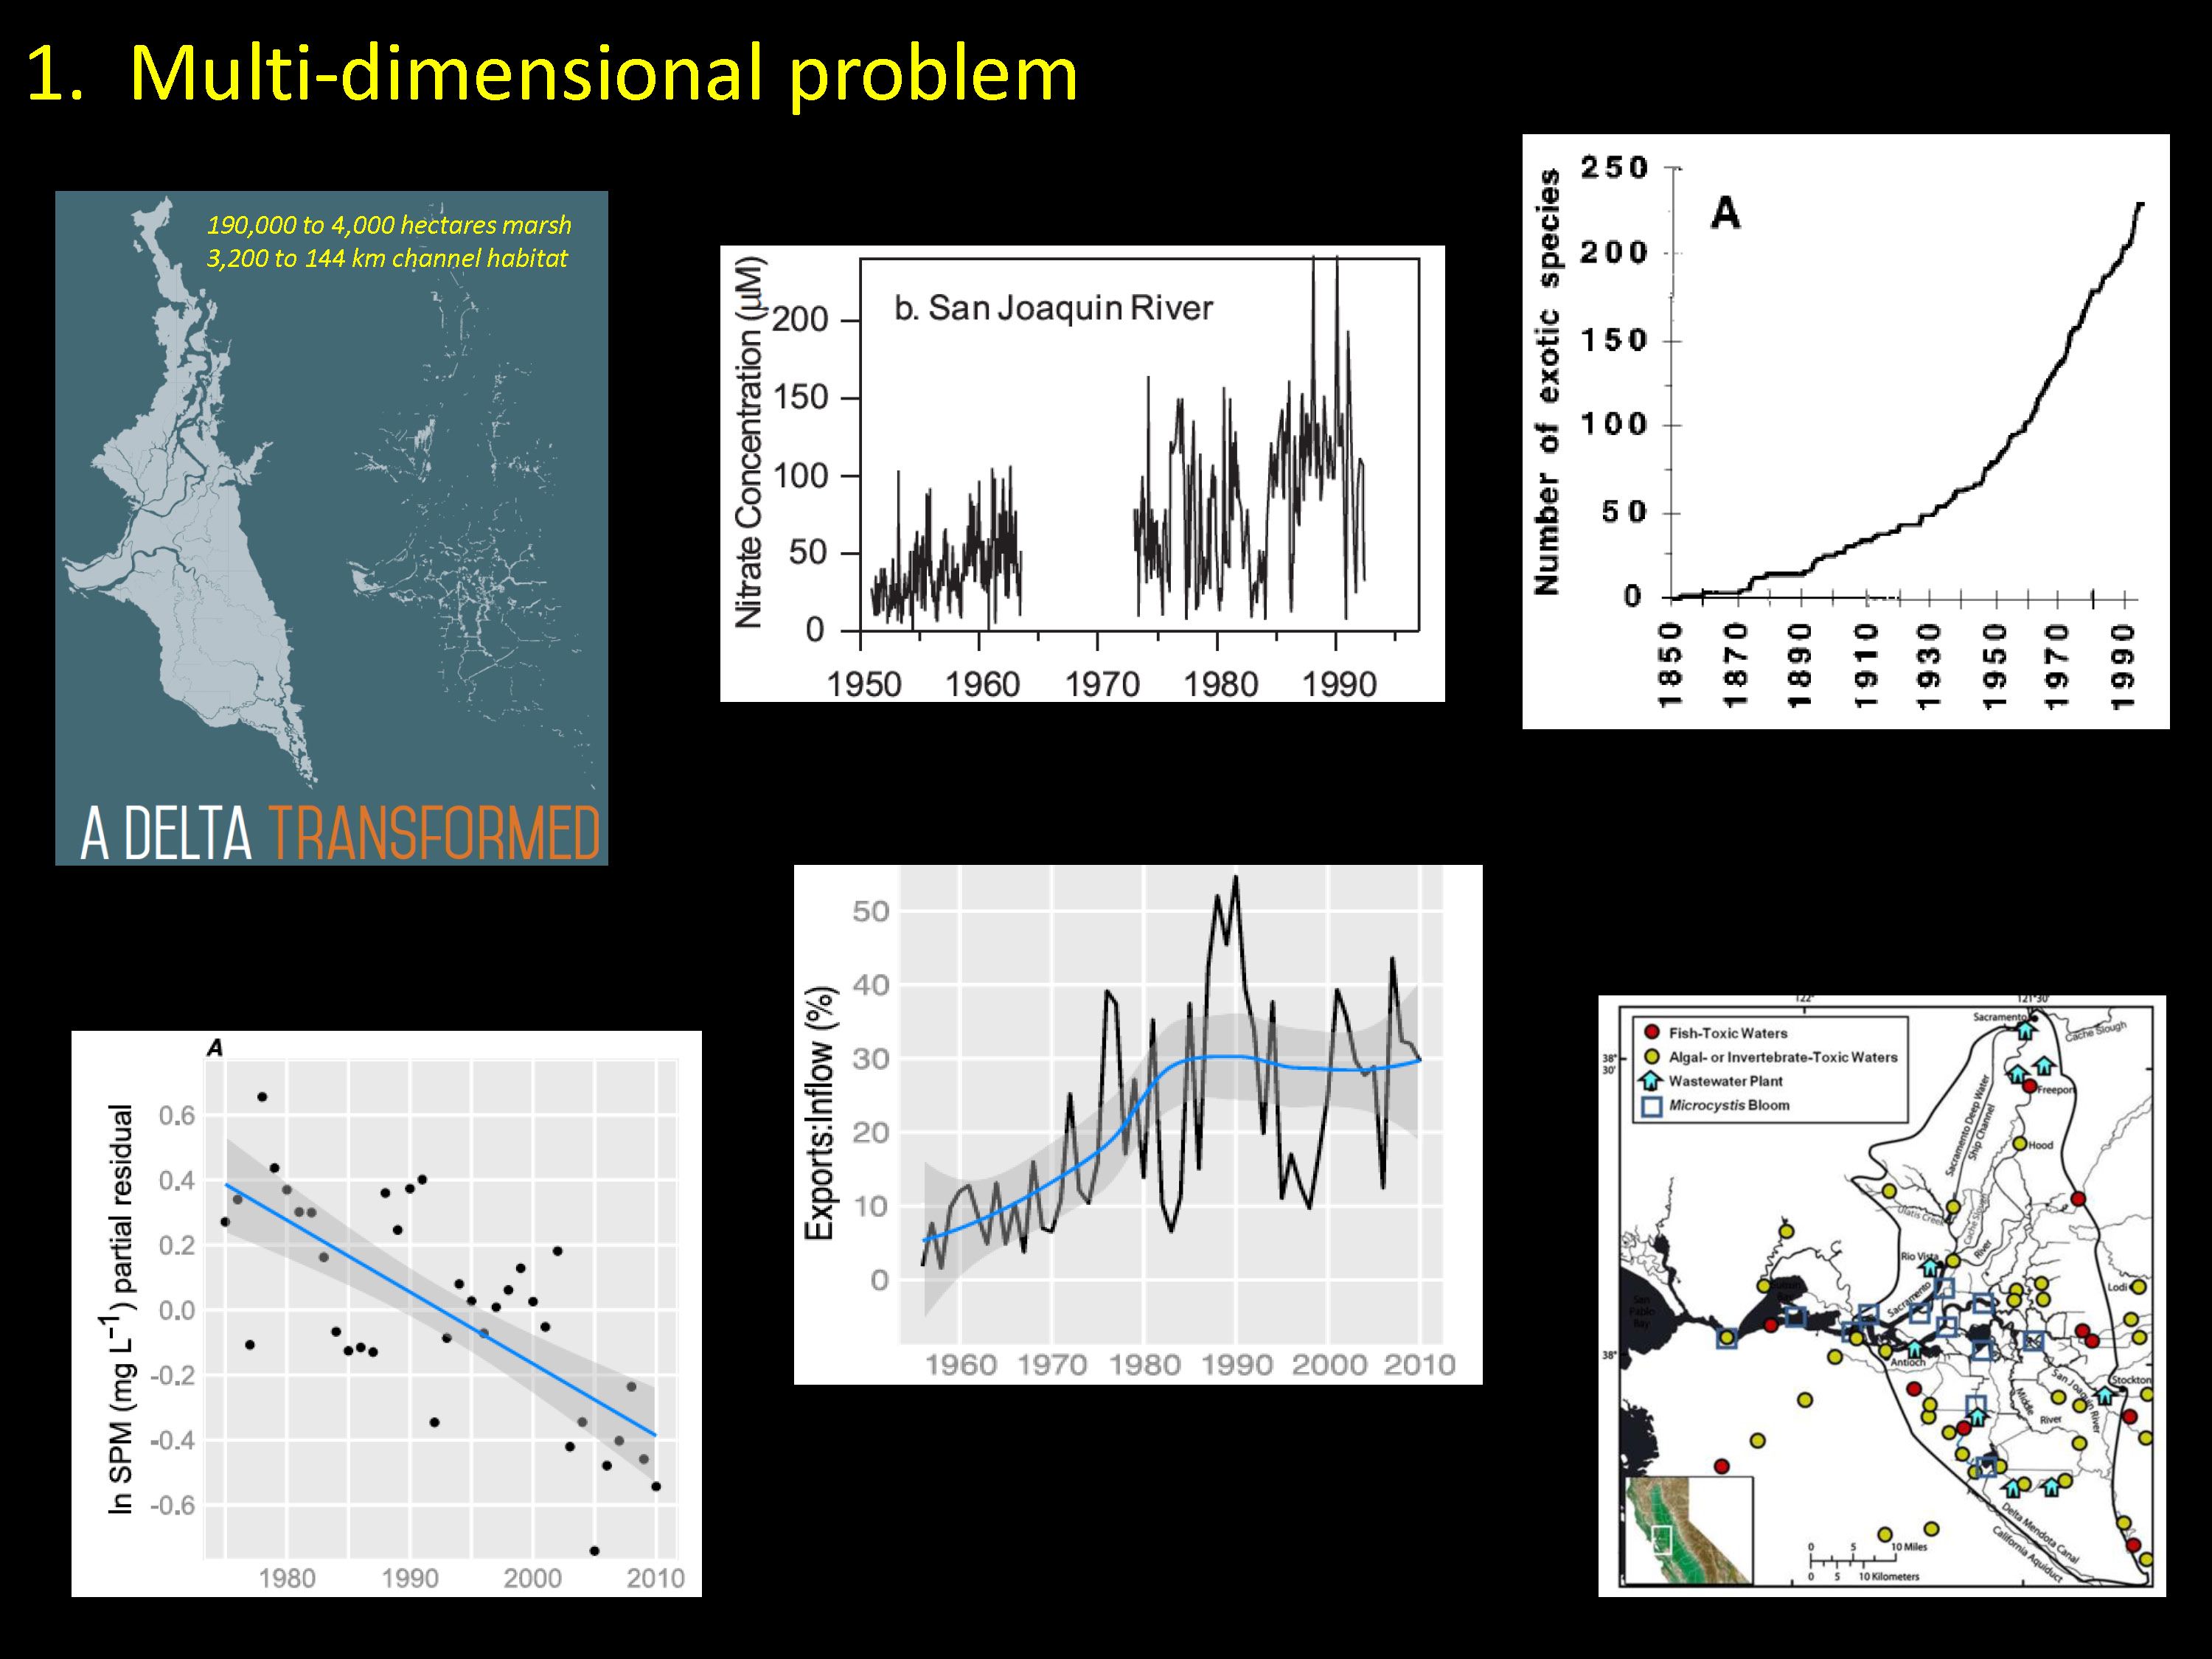
“This is not a single factor problem; this is a multi-factor problem and if we just step back and look at the ways in which human actions have transformed the Delta, it really is remarkable,” Dr. Cloern said. “We have completely transformed the landscape; we’ve enriched the estuary with nitrogen and phosphorous; we’ve introduced hundreds of species of invasive plants and animals to the Bay Delta; we’ve greatly modified sediment supply to the estuary; and we’ve altered the quantity and timing of freshwater inflow with effects on circulation in the Delta.”
“In my mind, the ultimate grand challenge is for us to understand how these different disturbances to the ecosystem work in synergy to reduce the carrying capacity of organisms that we’re trying to protect, and then amplify their populations,” he said.
 2-It’s not a local problem.
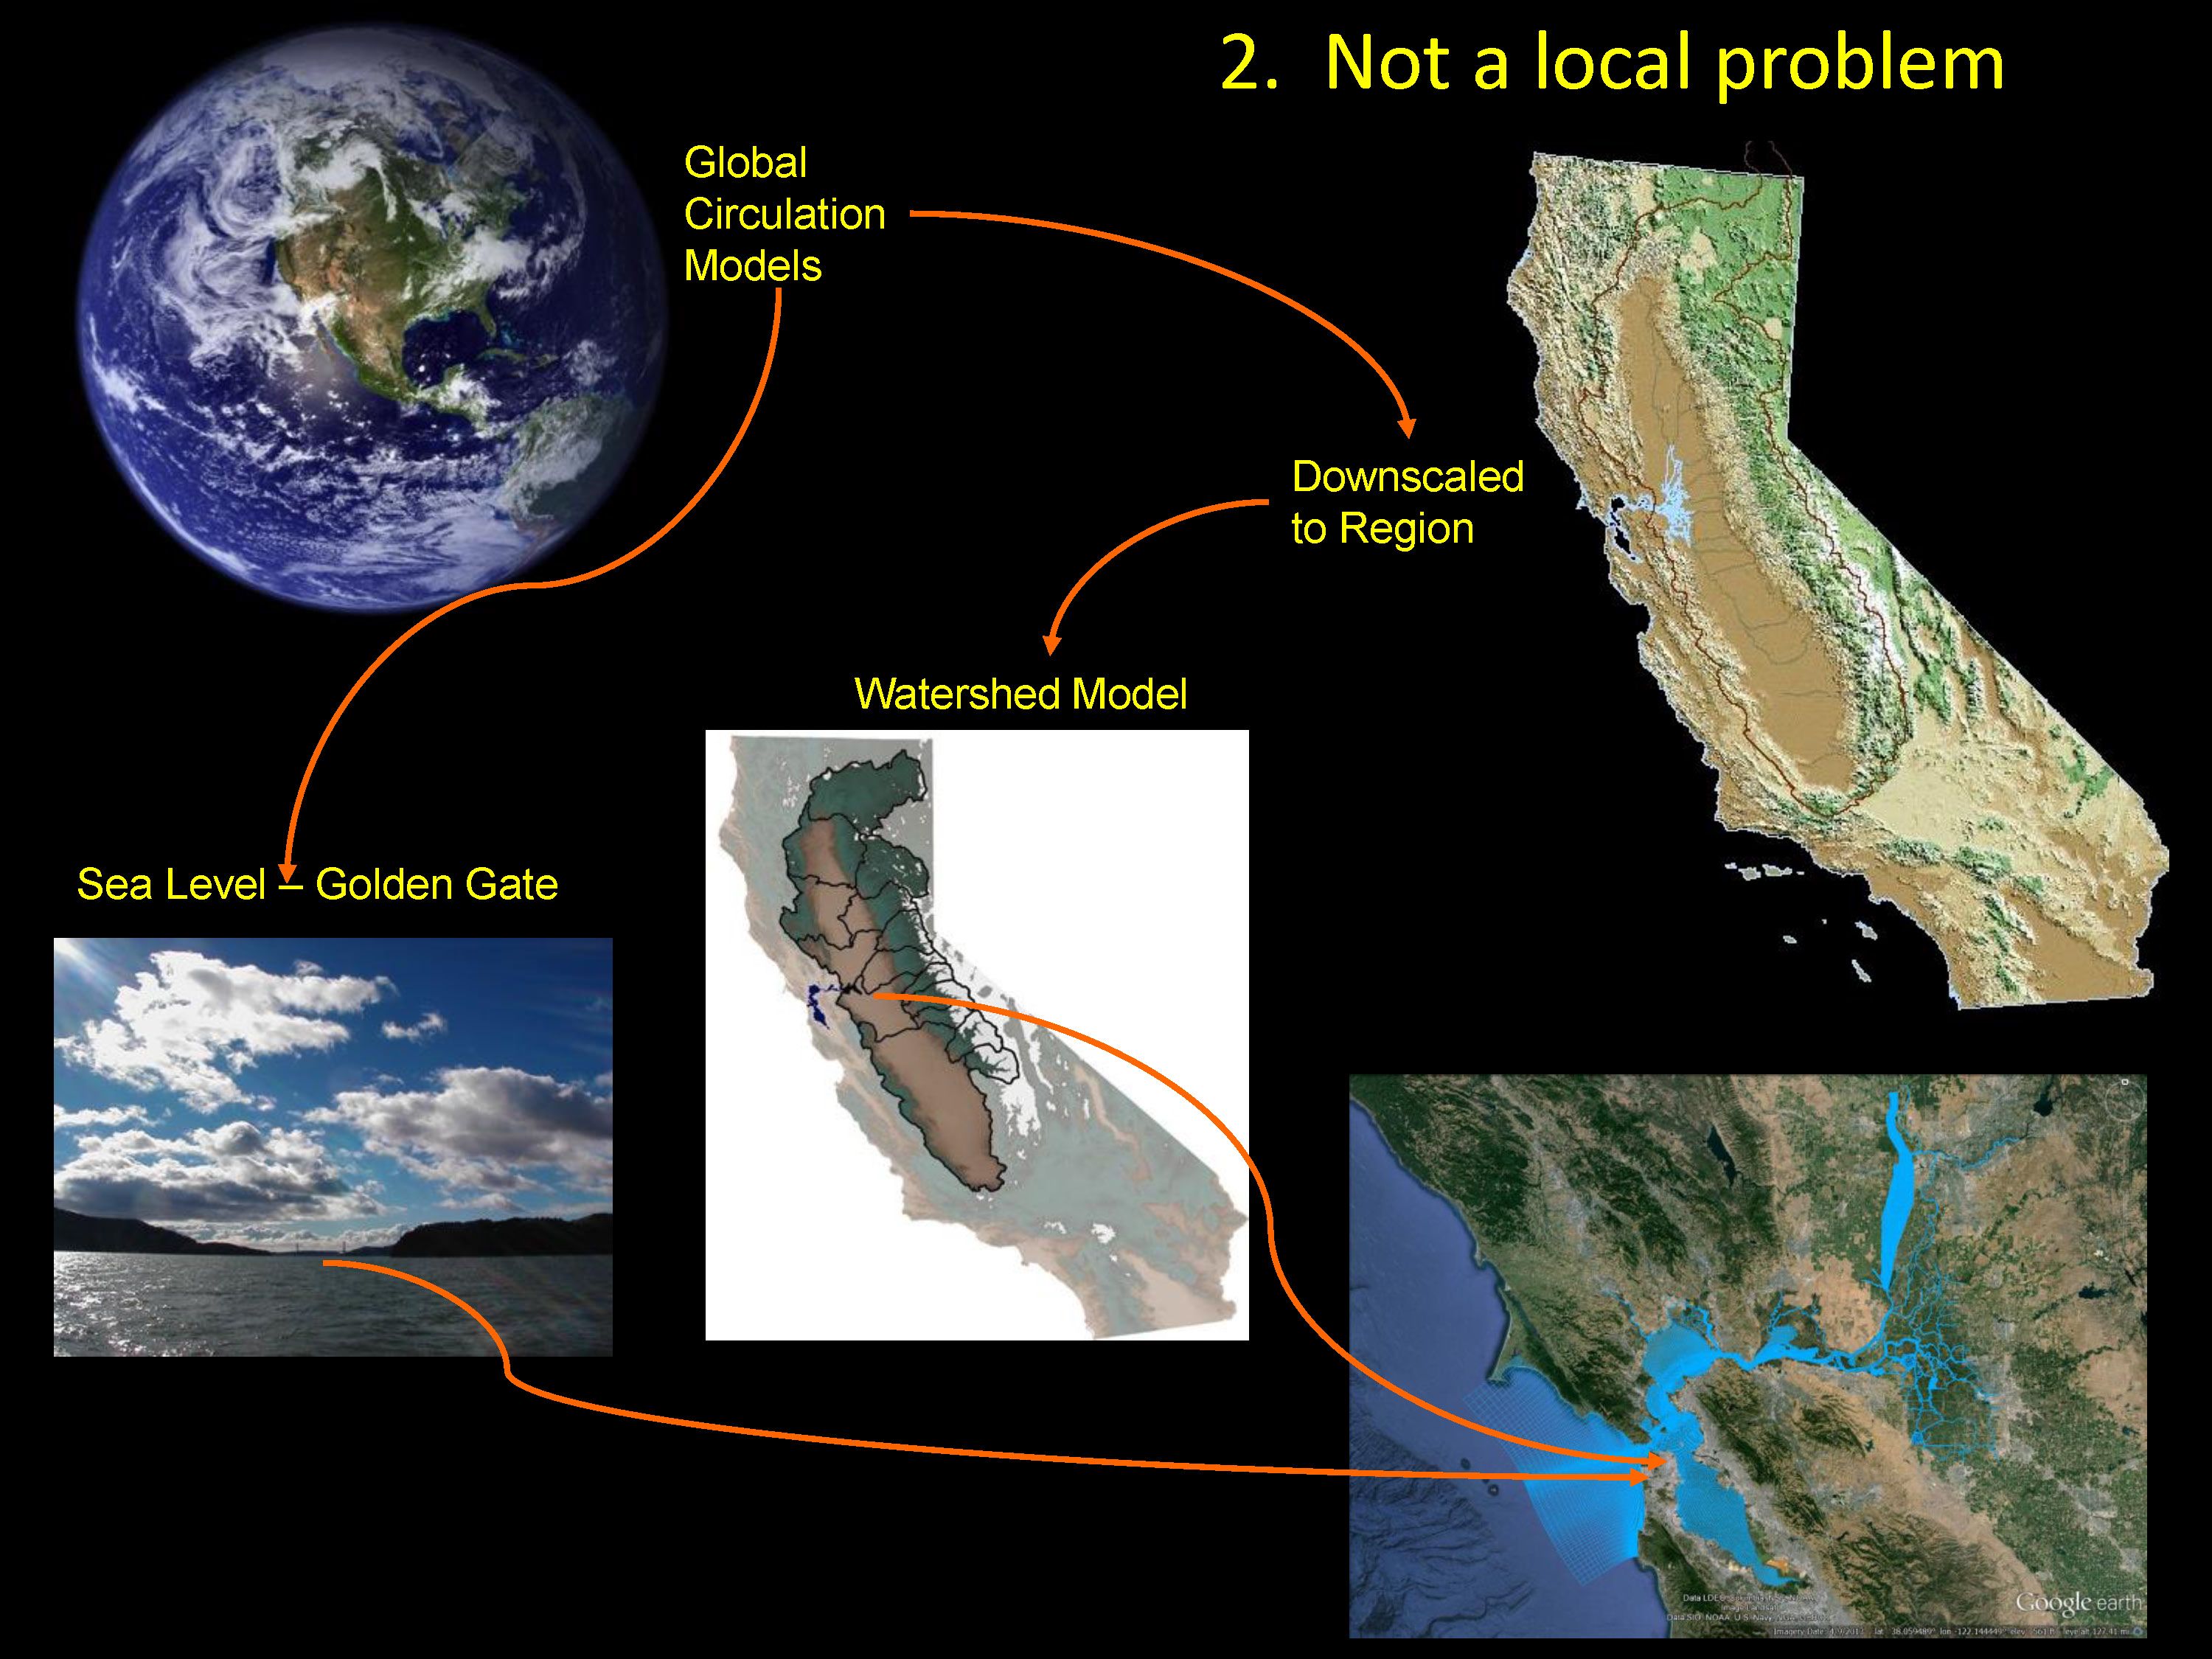
“This is not a local scale problem in any sense,” he said. “This is a schematic of how the Cascade project works. It begins with outputs of global circulation models because we know that the Bay Delta system responds to global scale climatic processes. We downscale to the region of California, so we need to look at how global scale processes bring about regional effects; then we downscale even further and look at how the regional effects at the scale of California have effects on the Delta, and so this is a complex problem in the sense that we have to take a broad geographic view, looking from inland to the crest of the Sierras and across the North Pacific Ocean.”
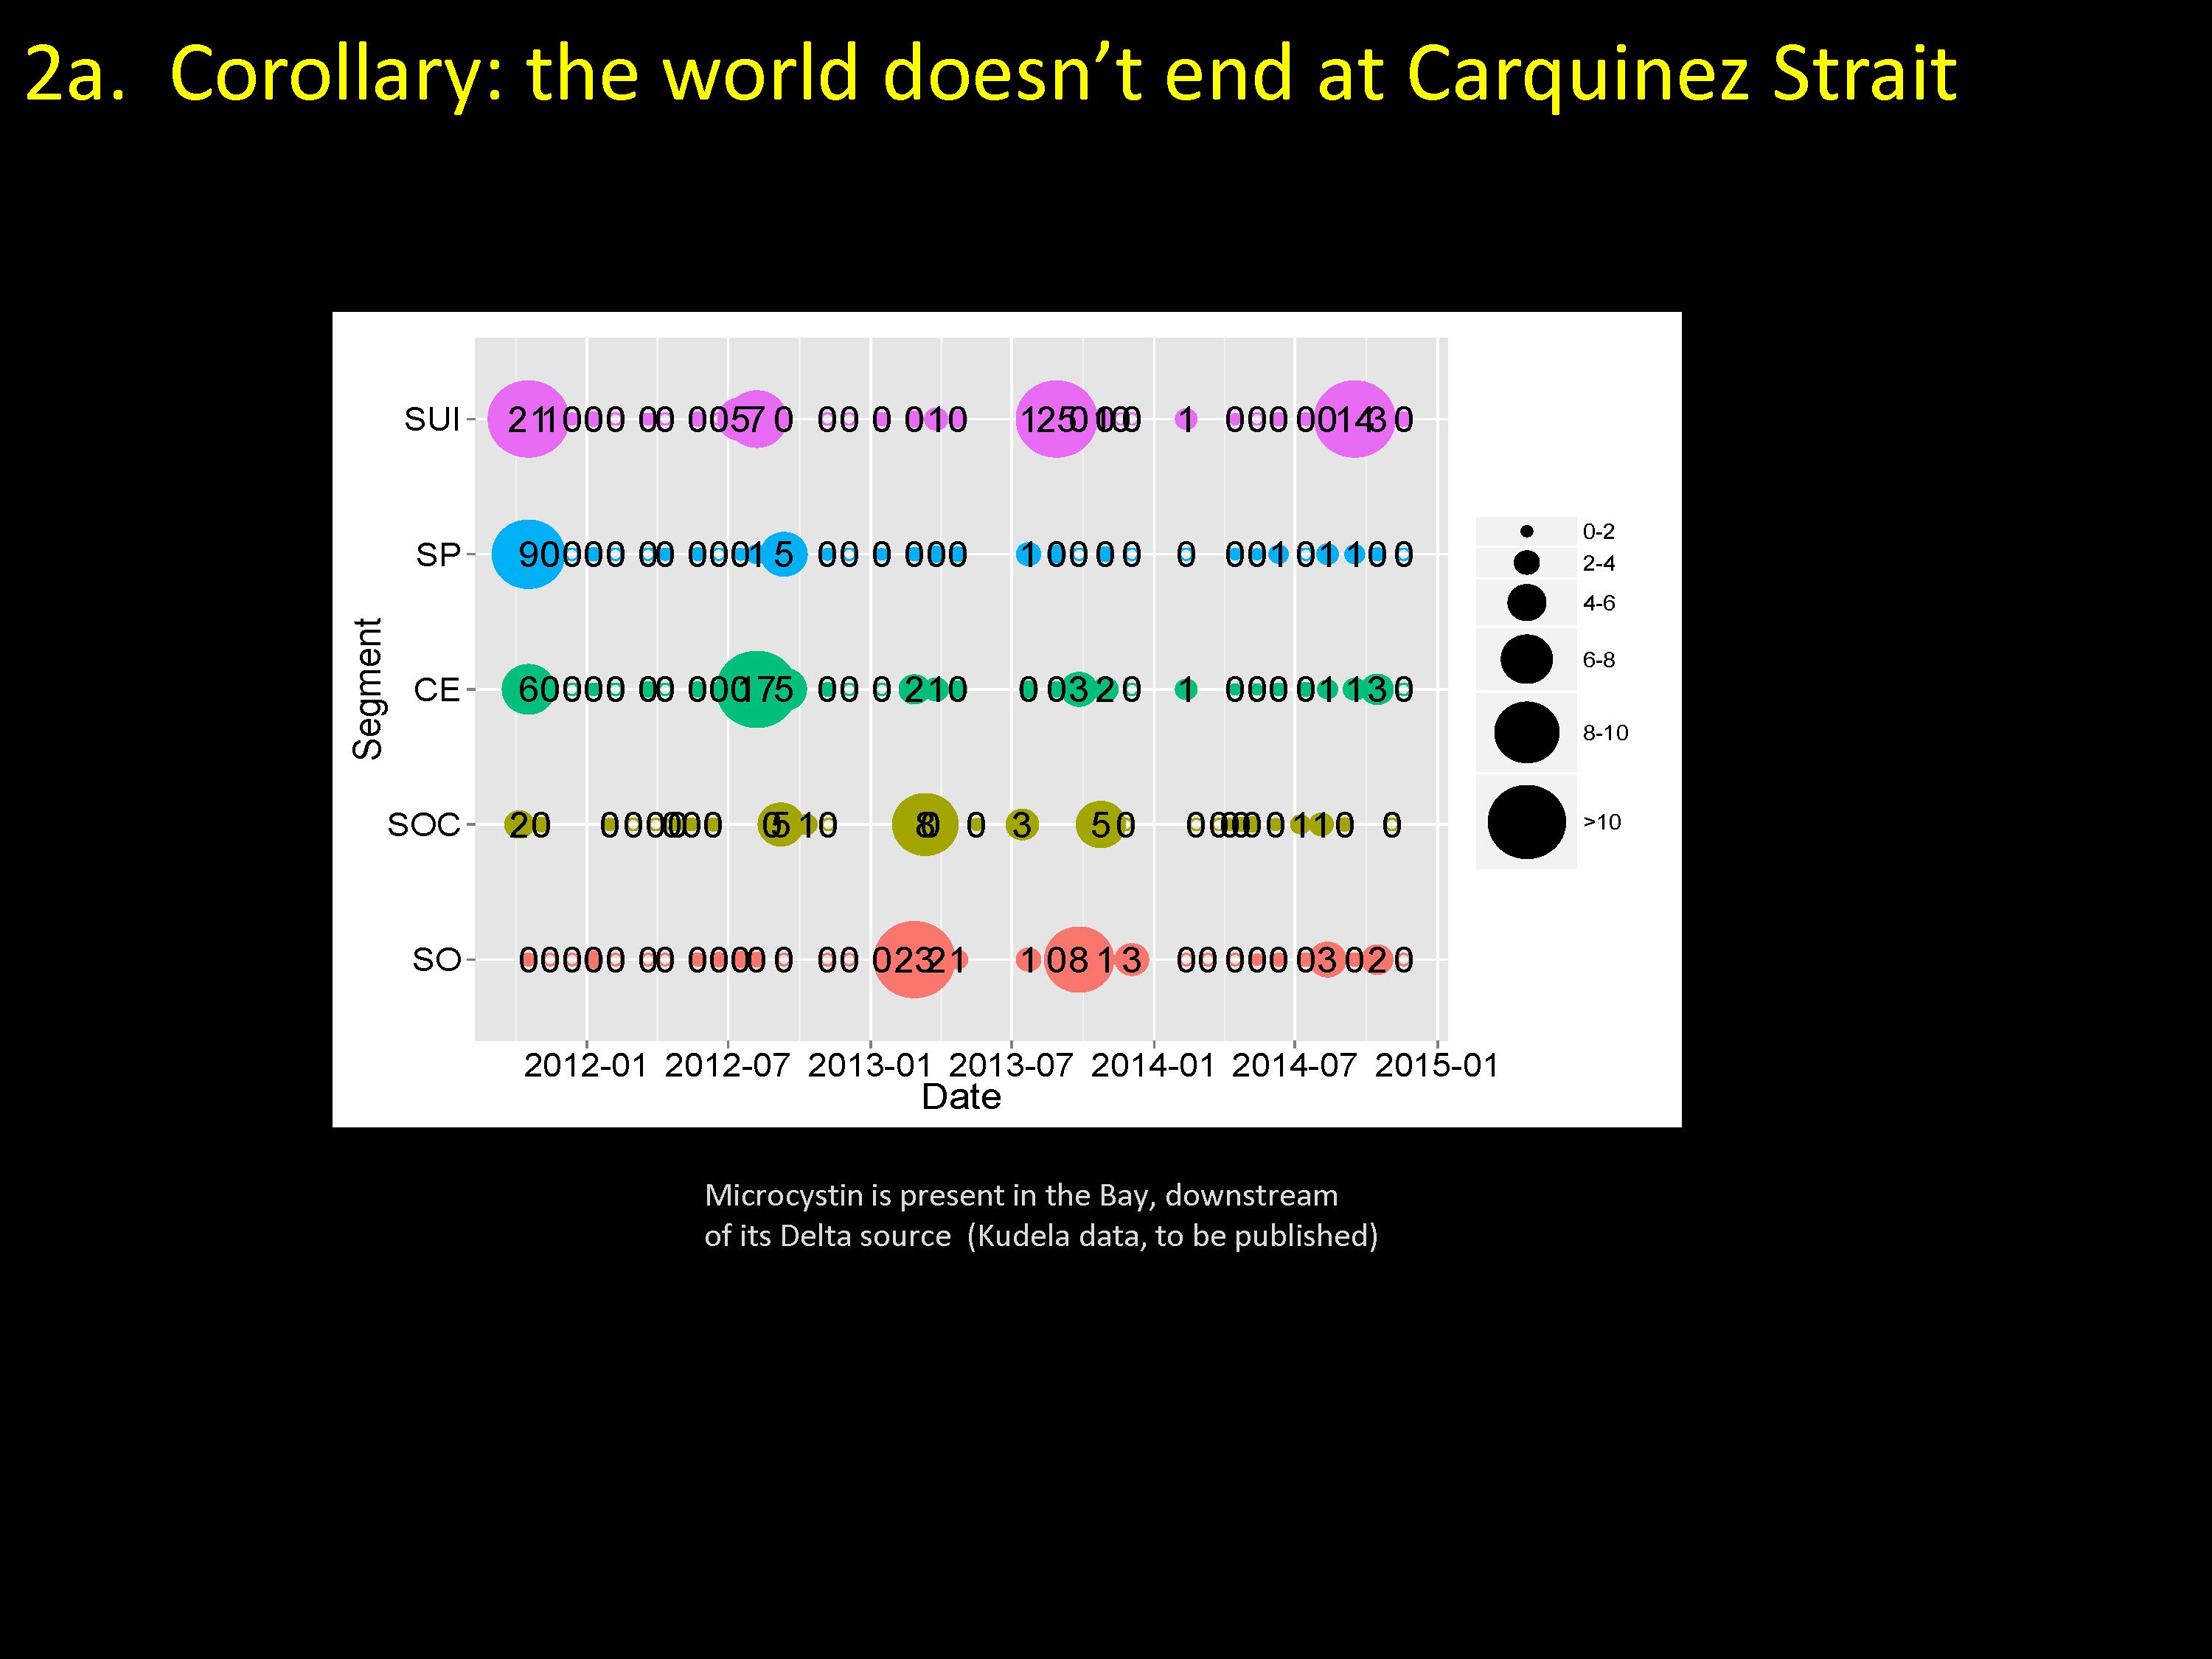 2A Corollary: The world does not end at Carquinez Strait.
“The world does not end at Carquinez Strait and here is why,” Dr. Cloern said, presenting a slide of new data of the presence microcystin in the estuary. He explained that the Y axis represents the position in the estuary where samples were taken: Suisun Bay, San Pablo Bay, Central Bay, South Bay, Lower South Bay, and the X axis is time. “These are samples collected over a three year period, and the size of the circles is an index of the concentration of microcystin in those samples,” he said. “The circles that have numbers in them are concentrations of microcystin that give us reasons to be concerned about.”
“Now as far as we know, microcystin is produced by the cyanobacteria microcystis that develops plumes in the Delta,” he said. “Microcystis does not grow in the Bay, so it looks like blooms of cyanobacteria that are producing microcystin in the Delta are having a downstream effect. The microcystis measured in the Bay likely originated in the Delta, so it’s just a reminder that events that develop in the Delta can have downstream effects, and this is part of this concept of local, regional, and global scale.”
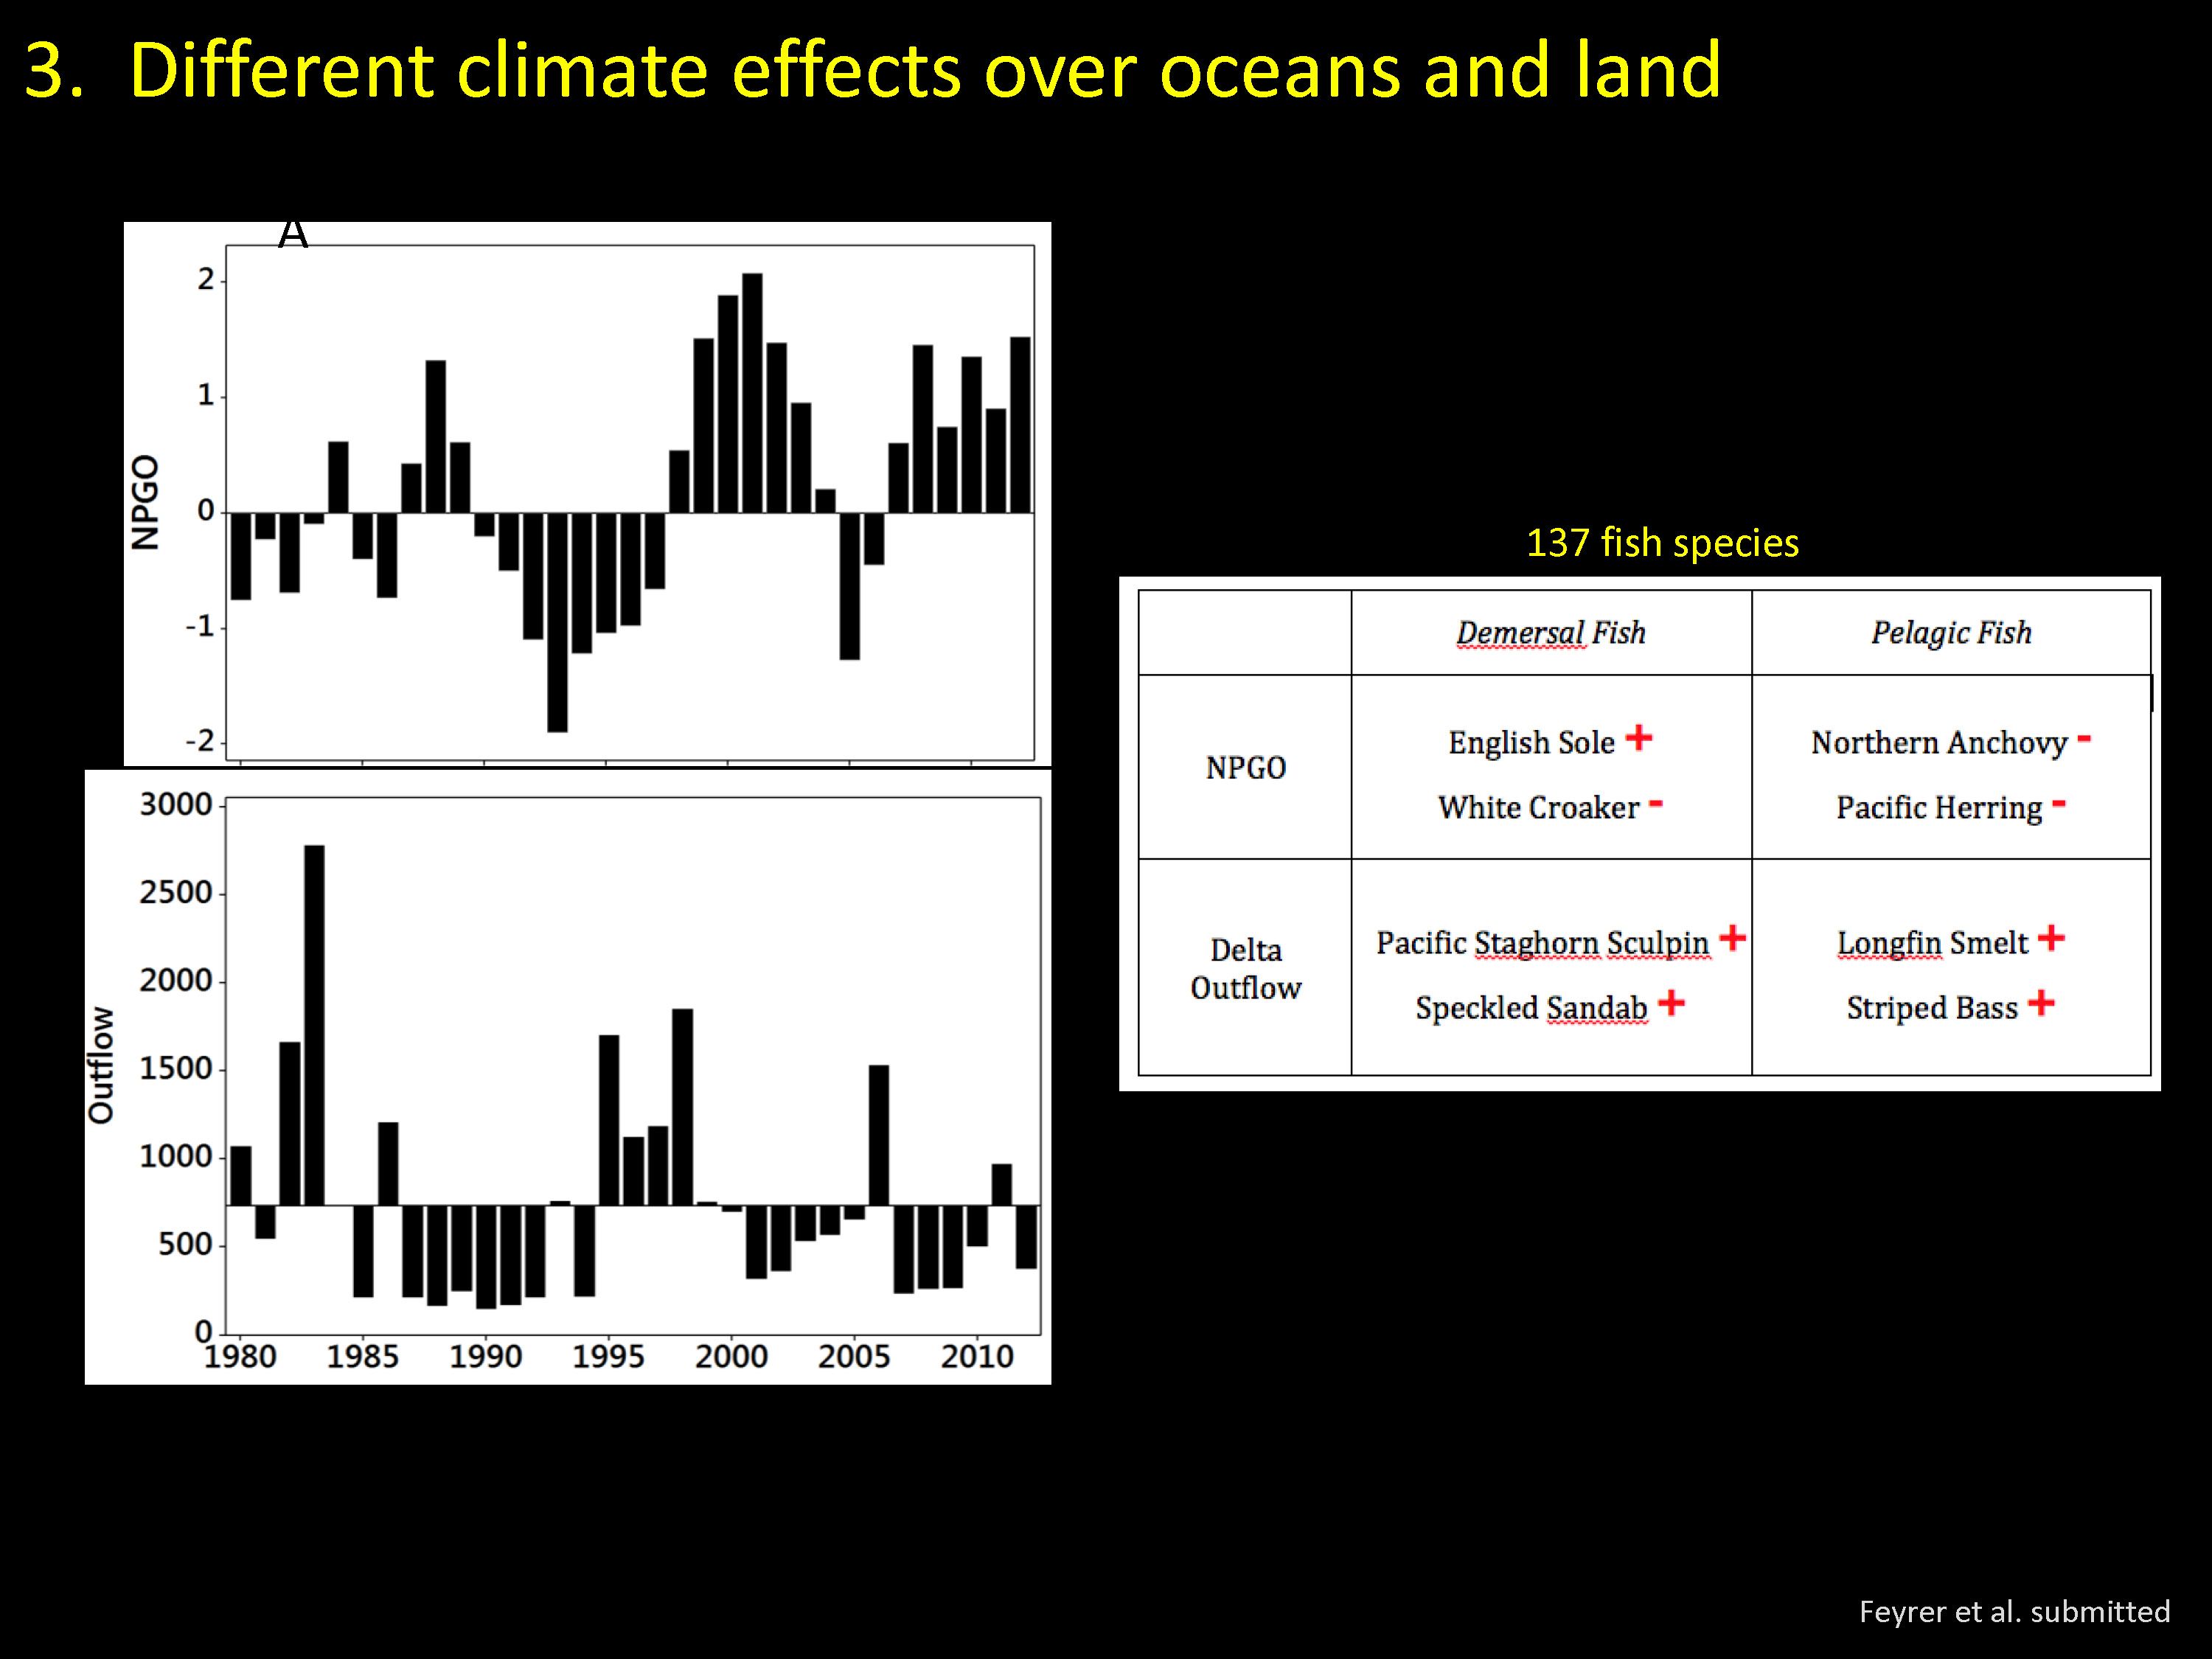 3-There are different climate effects over oceans and land.
“Estuaries are situated at the interface between oceans and land, and we have to remember that the climate system operates on very different types of processes over ocean basins then it does over watersheds,” Dr. Cloern said, presenting a slide with two charts. He explained that the top chart is a climate series of annual values of the North Pacific gyre oscillation which has a big effect on the Bay Delta system, and the second is a time series of outflow which represents precipitation and runoff over the watershed. “If you do a cross correlation analysis of these two time series, they are completely unrelated … So this is evidence that there are separate processes of variability operating over ocean basins than those operating over watersheds, and estuaries are situated at the interface between them so we have to take both of them into account.”
Dr. Cloern noted that the table is from a study just submitted for publication that grouped 137 species of demersal and pelagic fish by whether they have positive or negative associations with the large scale climate process of the North Pacific gyre, or Delta outflow. “The point is that organisms that use the estuary have a range of life histories,” he said. “Some of them track climatic processes over ocean basins and some of them track climatic processes over watershed. In terms of understanding the complexity of the estuary, we need to consider both.”
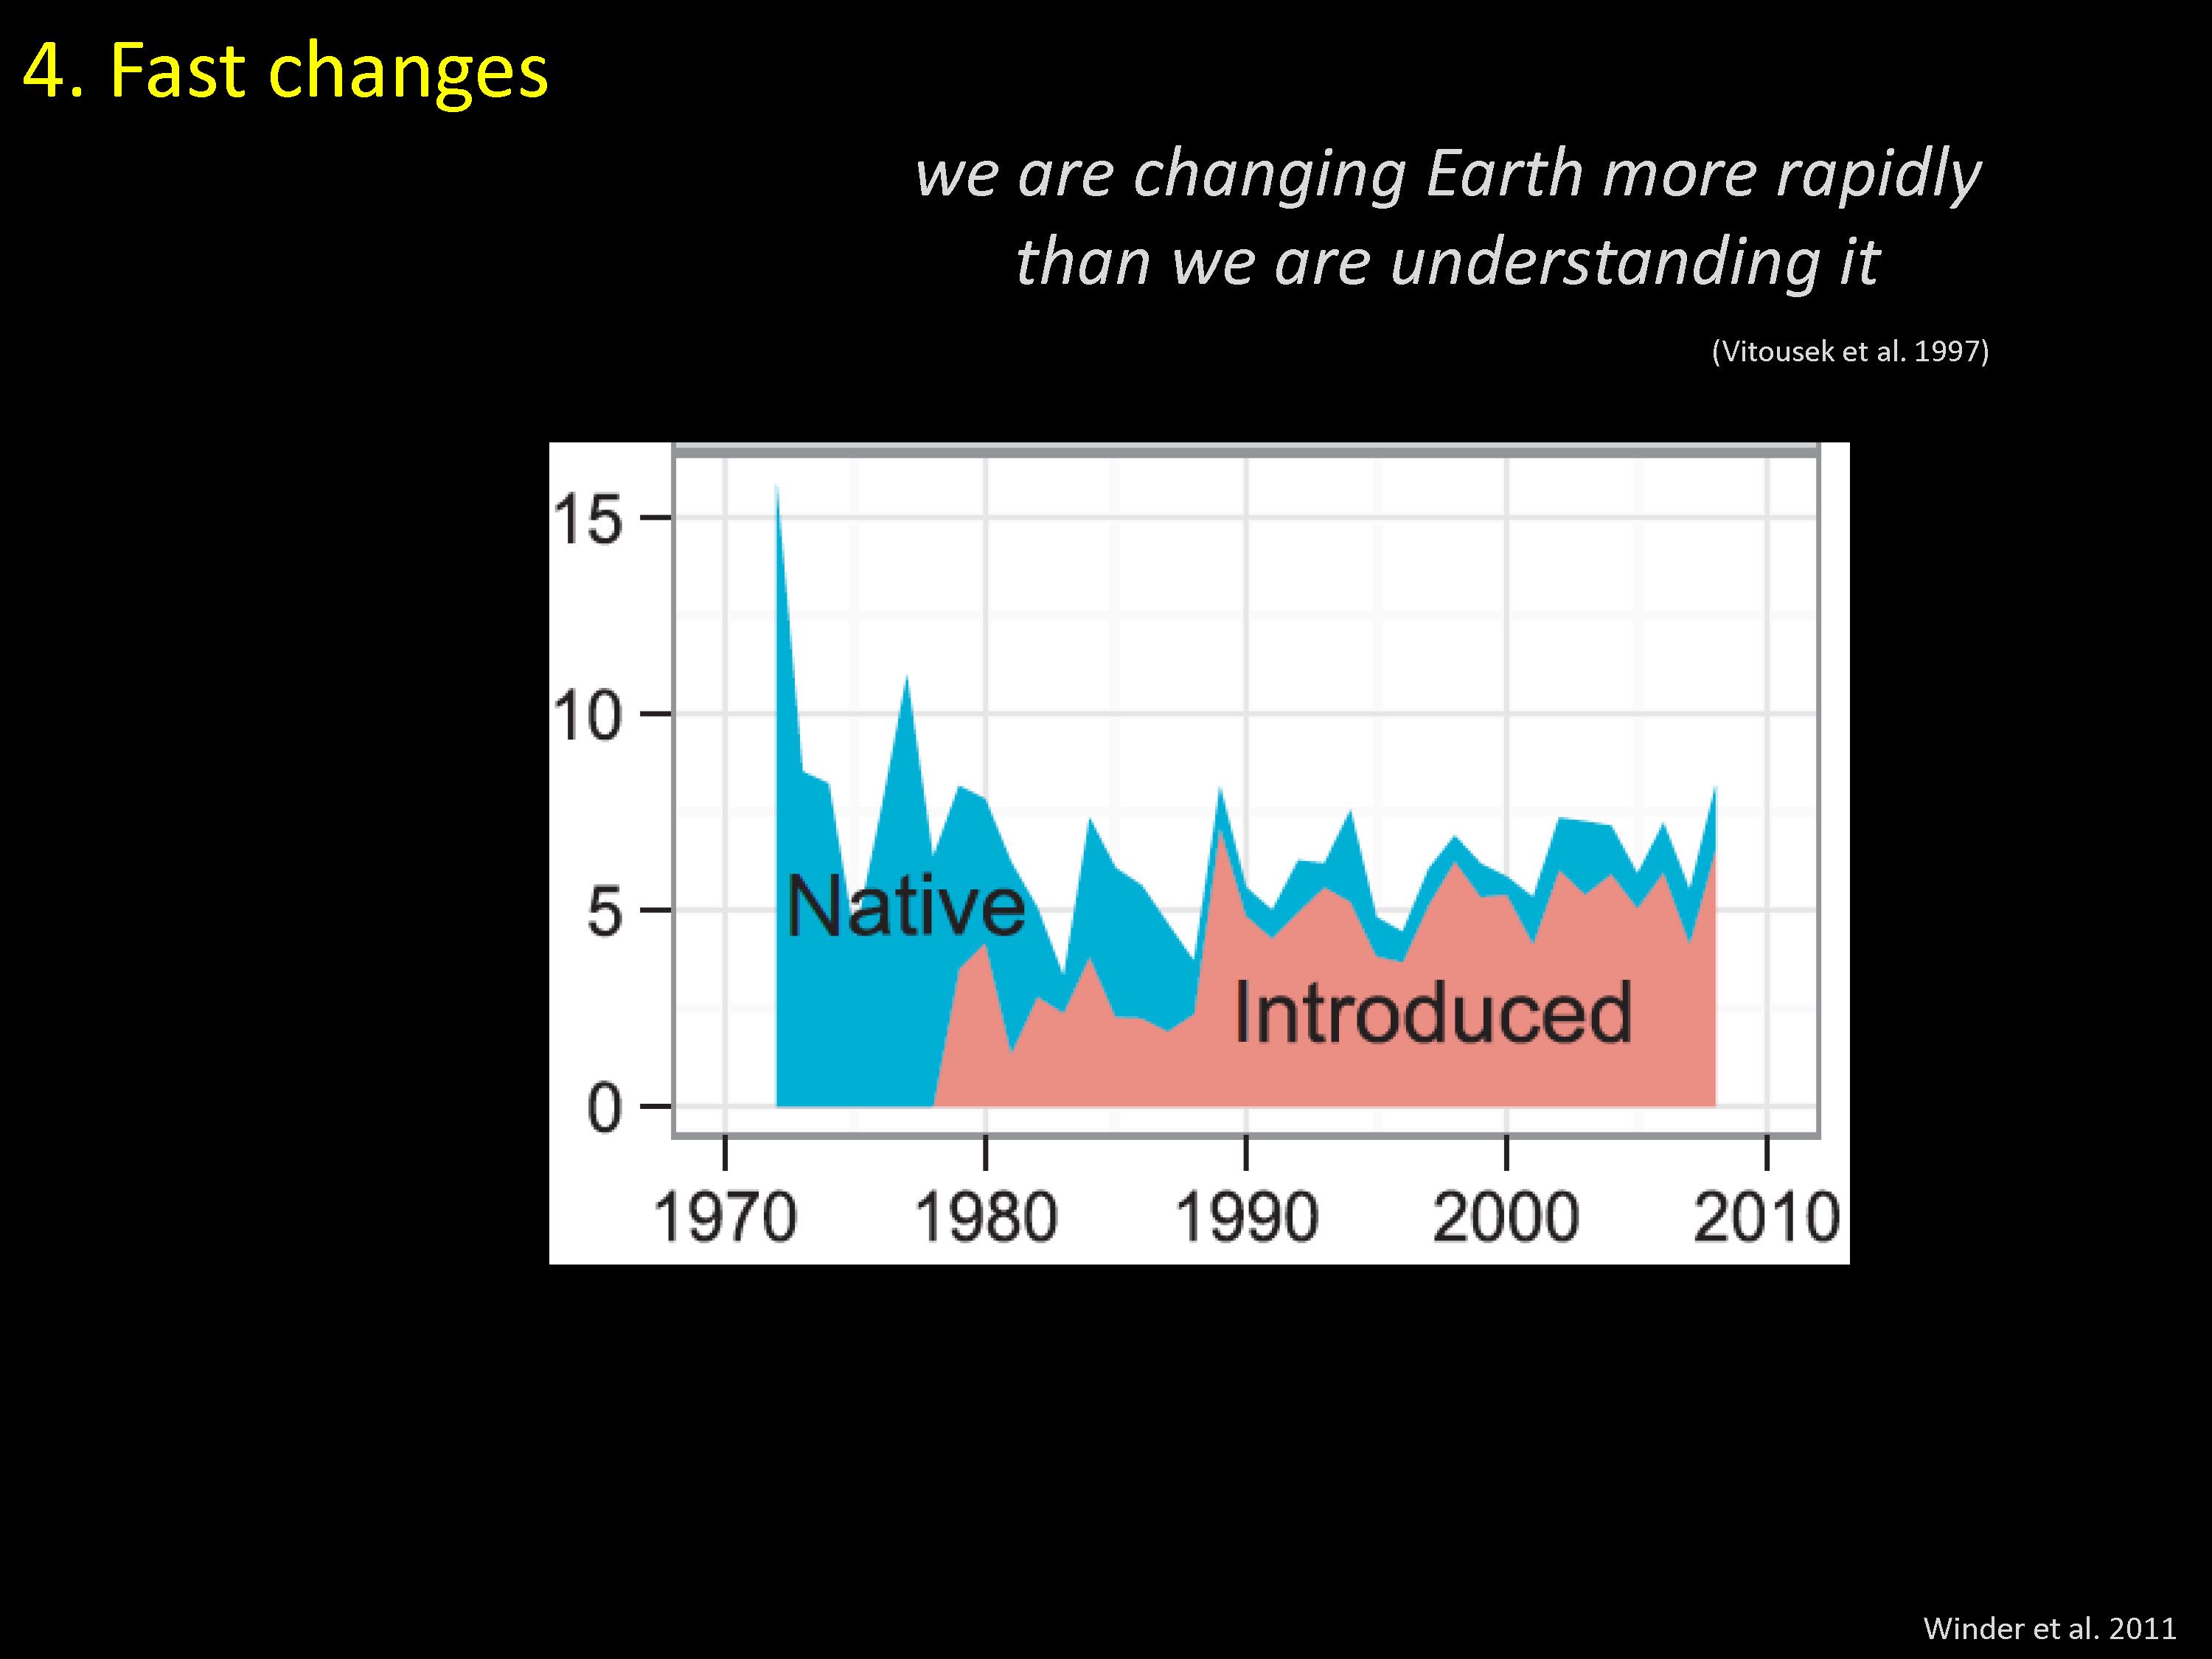 4-Change happens fast in the Delta.
“There is the breathtaking case of change that takes place in estuaries and the Delta in particular,” Dr. Cloern said, presenting a summary graph showing the remarkable restructuring of copepod communities in the low salinity part of the estuary that occurred in just a matter of years. “The case of change in the Delta reminds us of this quote from this landmark paper of Peter Vitousek, ‘We’re changing the world more rapidly than our understanding’, and that is certainly true of the Delta. It’s an enormous challenge for those of us trying to keep up with the changes in the estuary.”
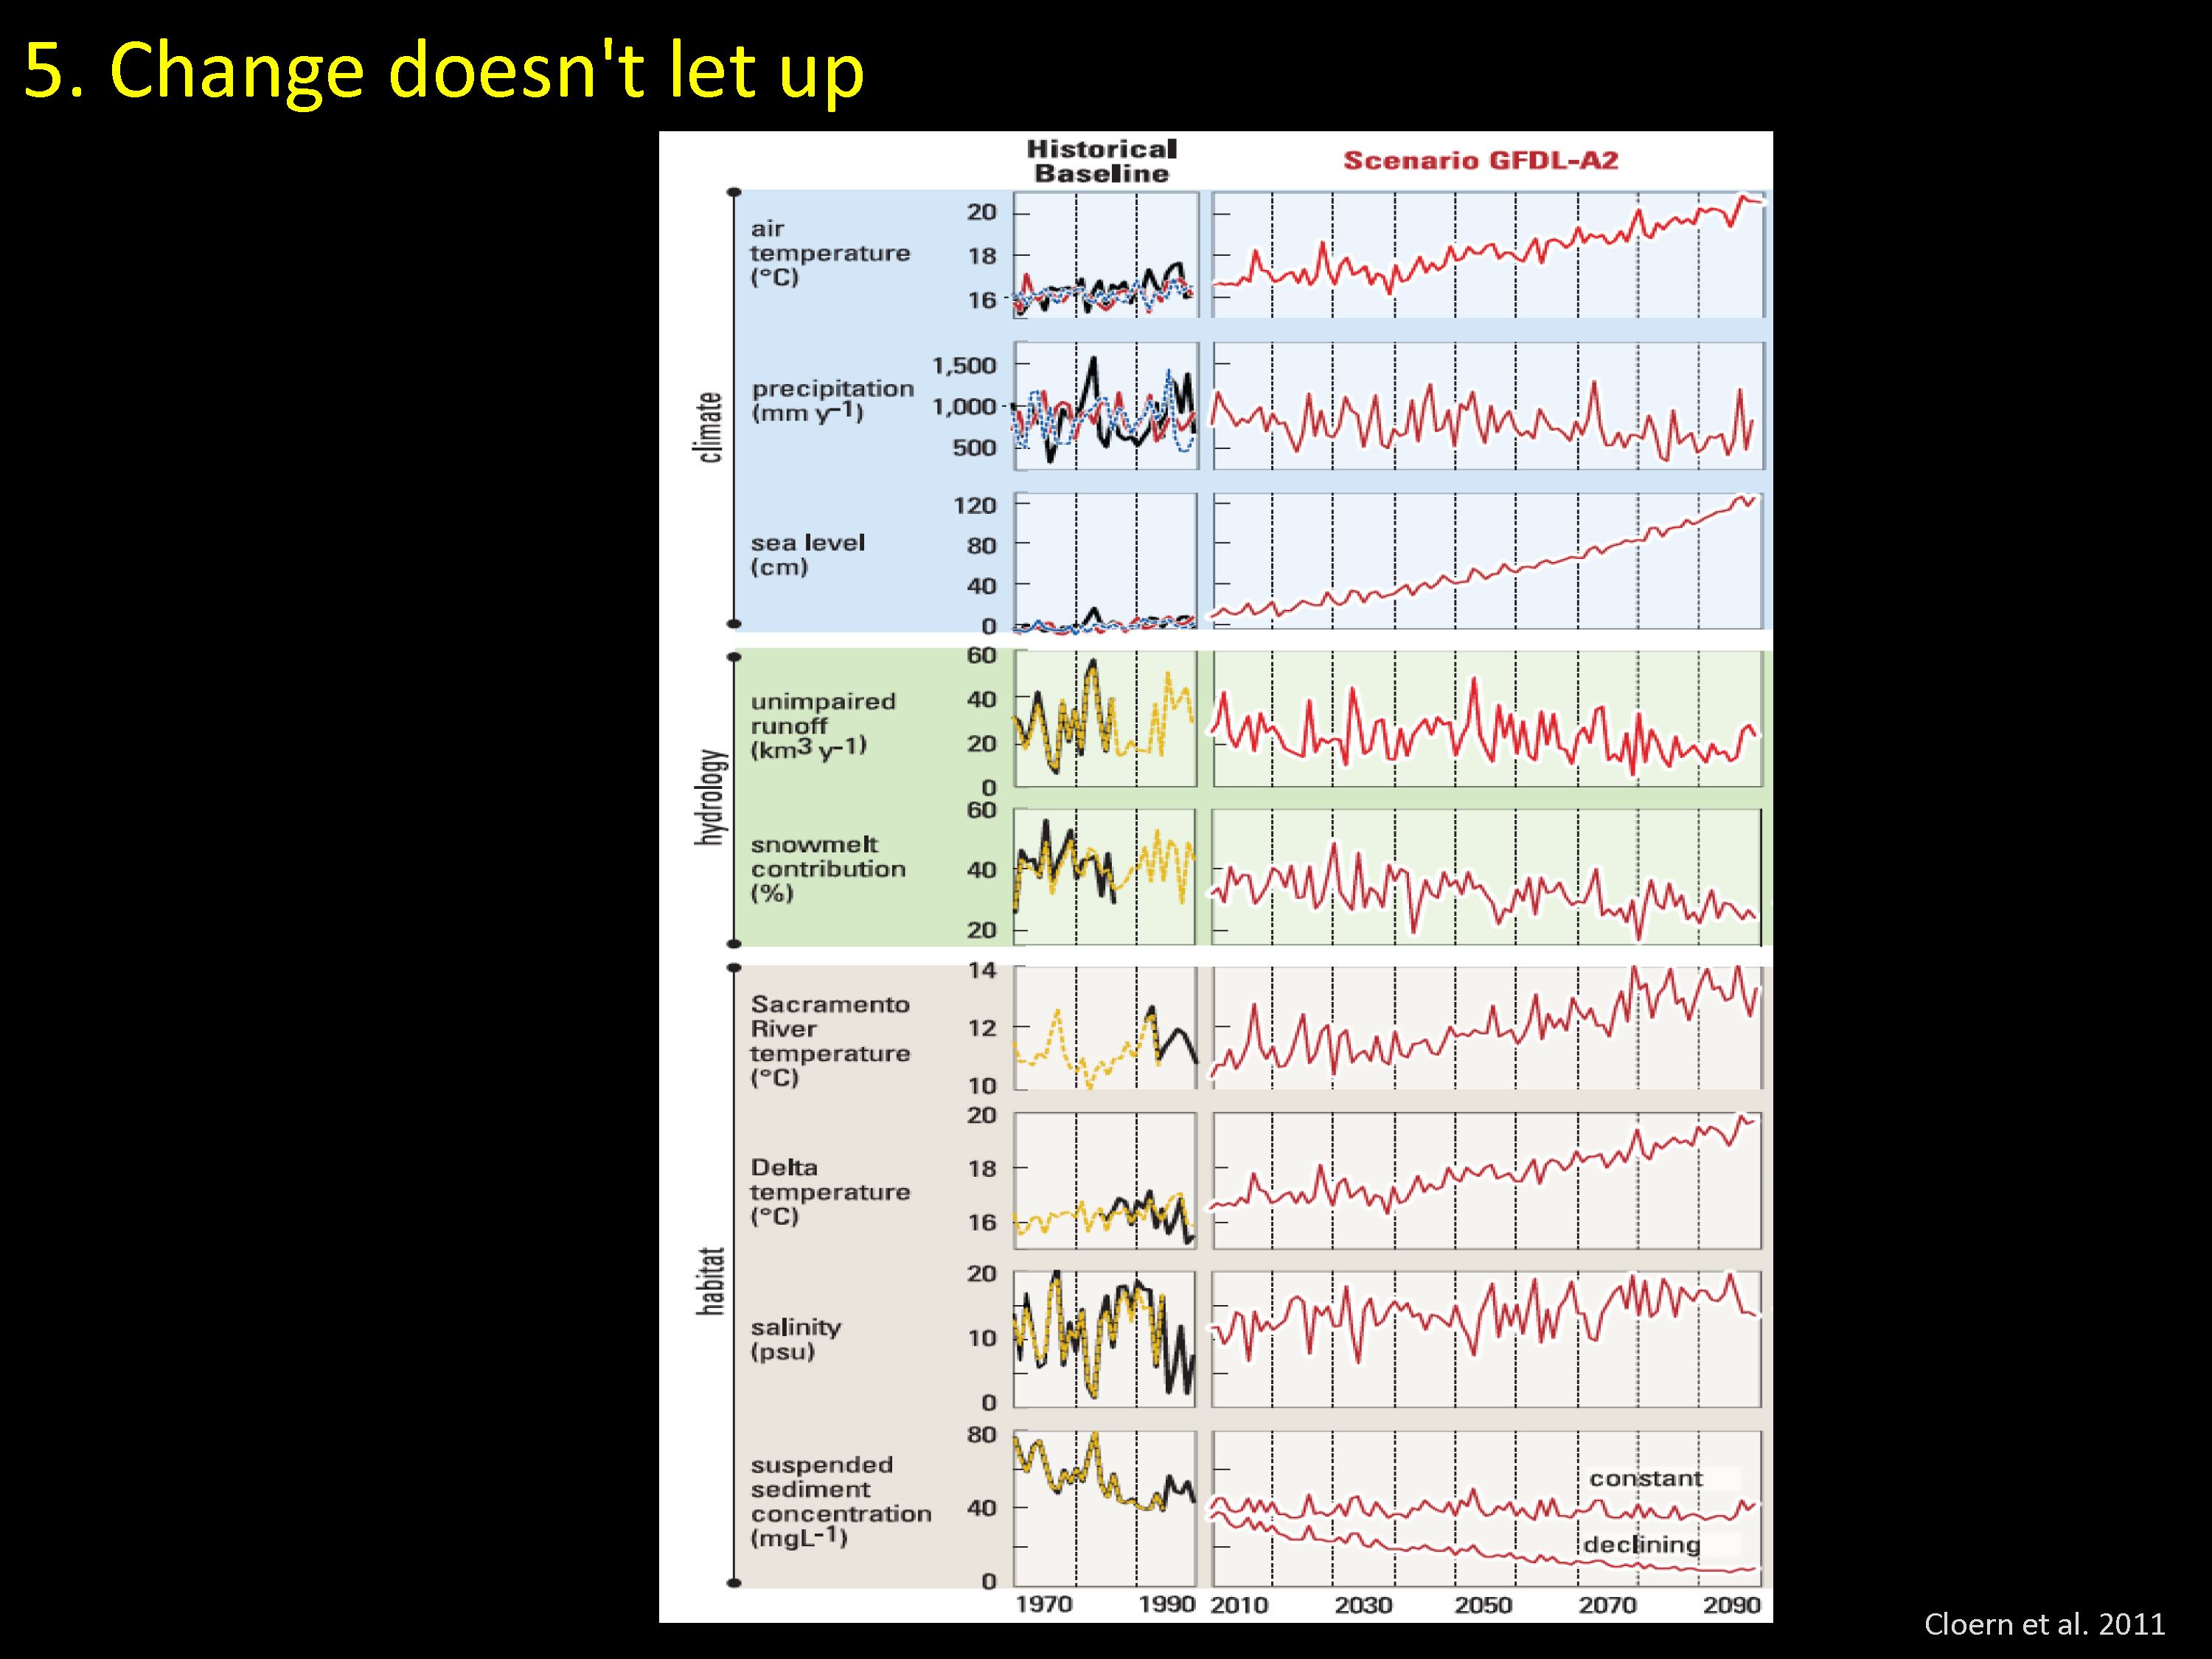 5-Change doesn’t let up.
“On top of that, change doesn’t let up,” he said. “The Bay Delta system is in a continuing state of change. The Bay Delta system that exists today is in some ways unrecognizable from the Bay Delta system that I started studying in 1976, and in the next 38 years, the Bay Delta system is going to be transformed beyond probably our imagination. We need to keep up with this.”
 6-Complex non-linear dynamics.
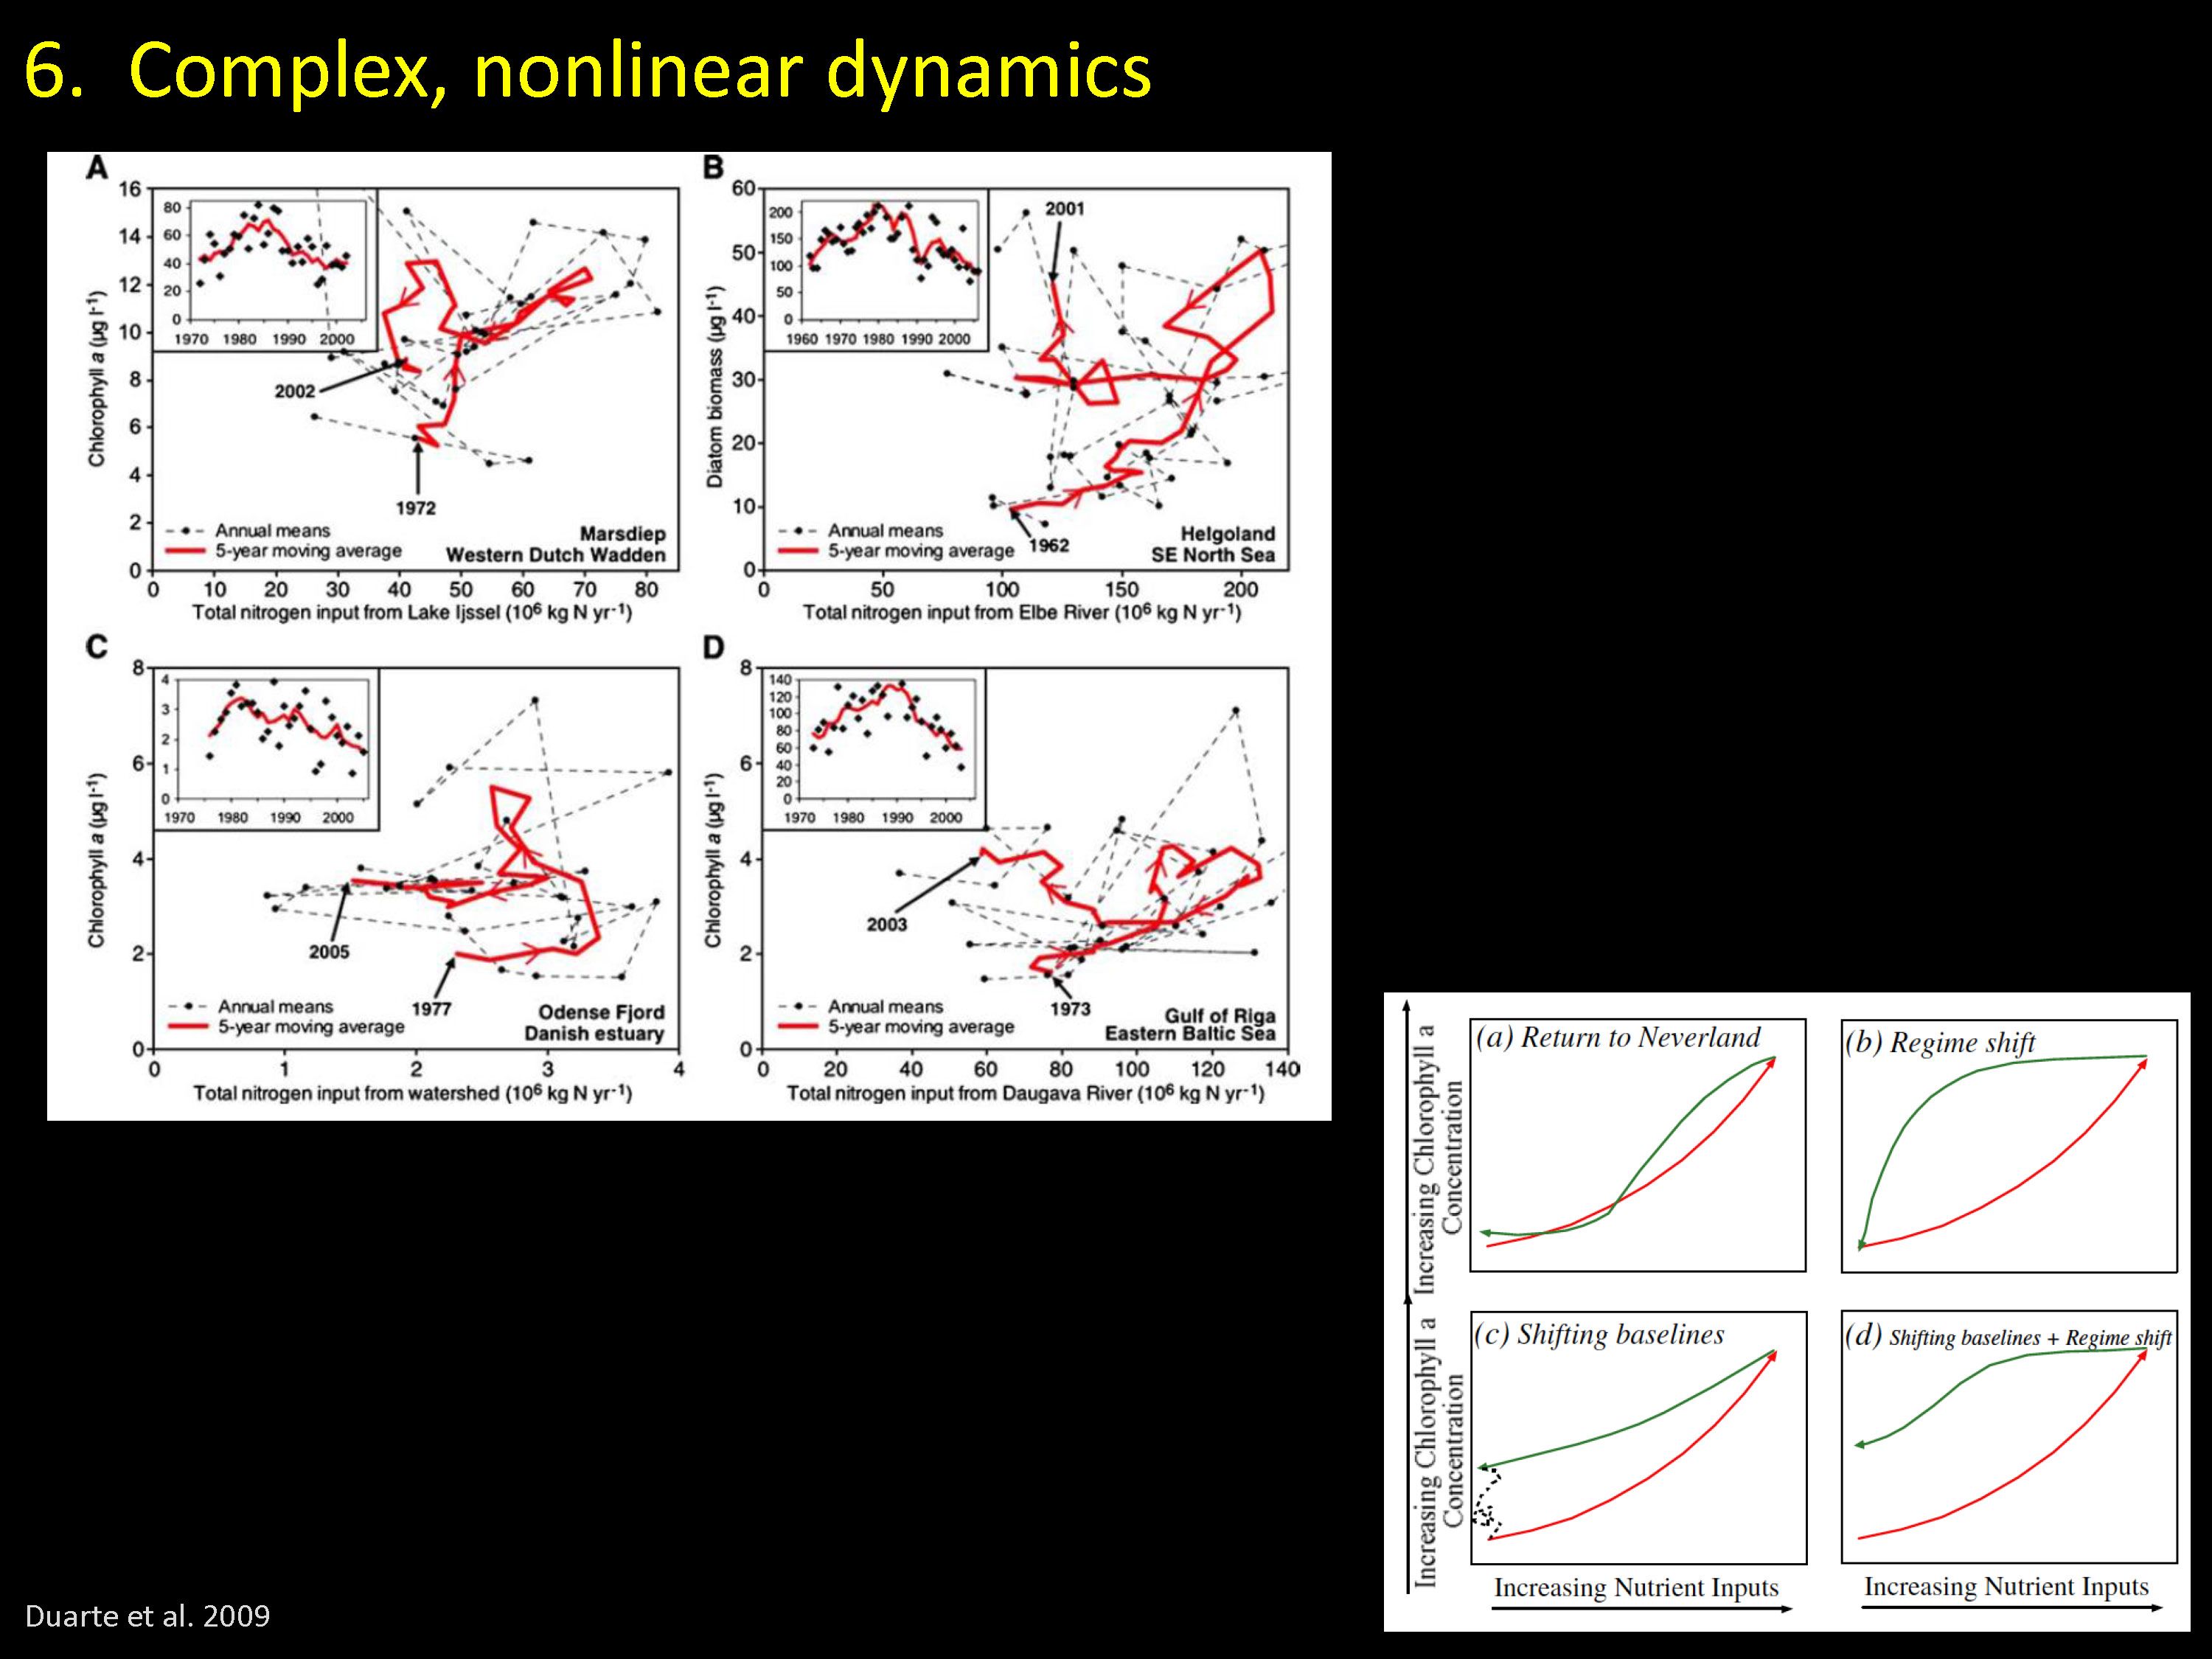
“Estuaries and ecosystems have dynamics that are complex and nonlinear,” Dr. Cloern said, presenting an example from a paper on the problem of eutrophication. “These are measurements made over a period of decades in four different estuaries in Europe and the insets of each of these show a period of increasing nitrogen input followed by a period of decreasing nitrogen input. The problem is that we enrich the estuaries so much that we produce excess phytoplankton biomass that led to hypoxia and all the other problems, so policies were implemented to reduce the nitrogen loadings to all four of these estuaries.”
 “We know that as we increase nutrient loading, phytoplankton biomass went up, and we hoped and expected that if we reduced nutrient loadings, that they would retrace that same trajectory,” he said. “But these are measured trajectories, and none of them follow the trajectory of enrichment. The authors suggested a number of possible explanations … One is that is that we recognize that sometimes we have to cross a threshold or a tipping point before changes actually take hold in these complex ecosystems. The other is that as we reduce nutrient inputs, we end up at a different place in terms of phytoplankton biomass then where we started, and they describe this as a regime shift.”
“In both cases, what this means is that the efficiency of the estuary of converting nutrients in the phytoplankton biomass increase, and we can expect really complex processes that involve interactions between regime shifts and shifting baselines,” Dr. Cloern said.
“So if we were in Boston, we would call this a wicked hard problem.”
DR. WIM KIMMERER
Upper food web
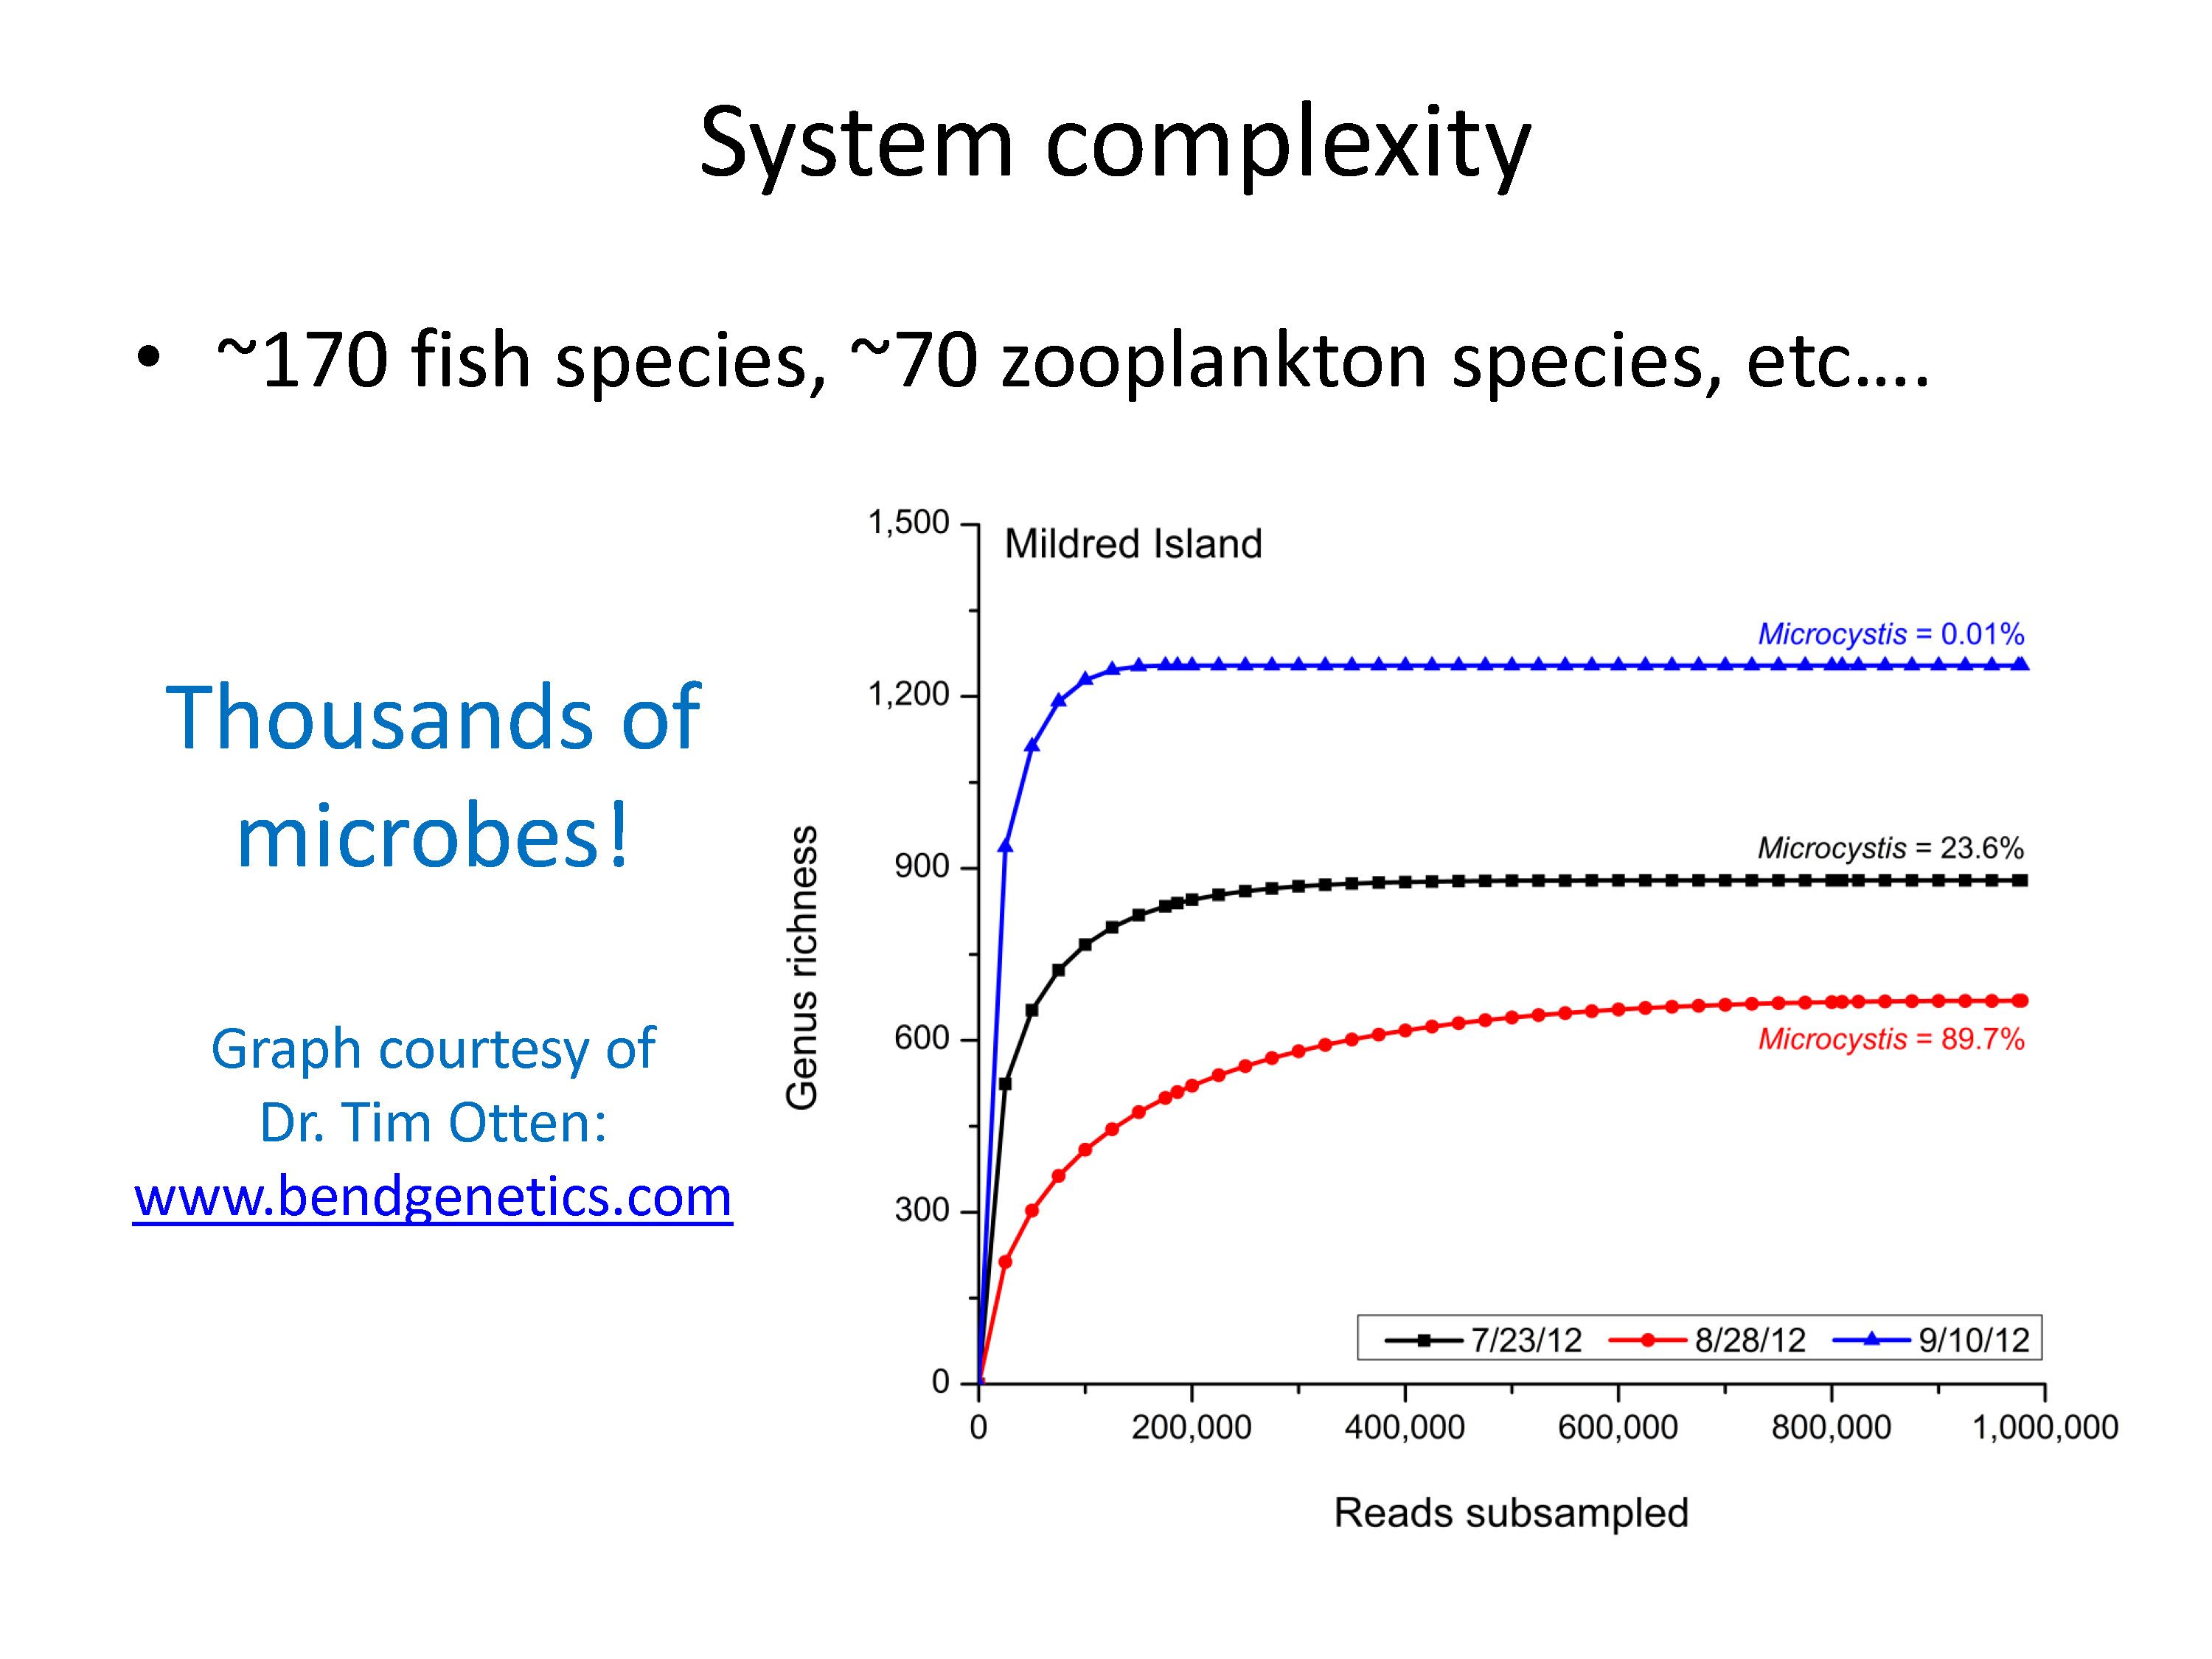 Dr. Wim Kimmerer began his presentation with some illustrations of complexity. “In the estuary, we’ve have something like 170 fish species, 70 zooplankton species, and a bunch of other things,” he said. “Tim Otten, working on microcystis with us, did a whole genome profile of just what particles were in 200 milliliters of water. And in areas not full of microcystis, he found 1300 genera. What are all those things doing? We have no idea.”
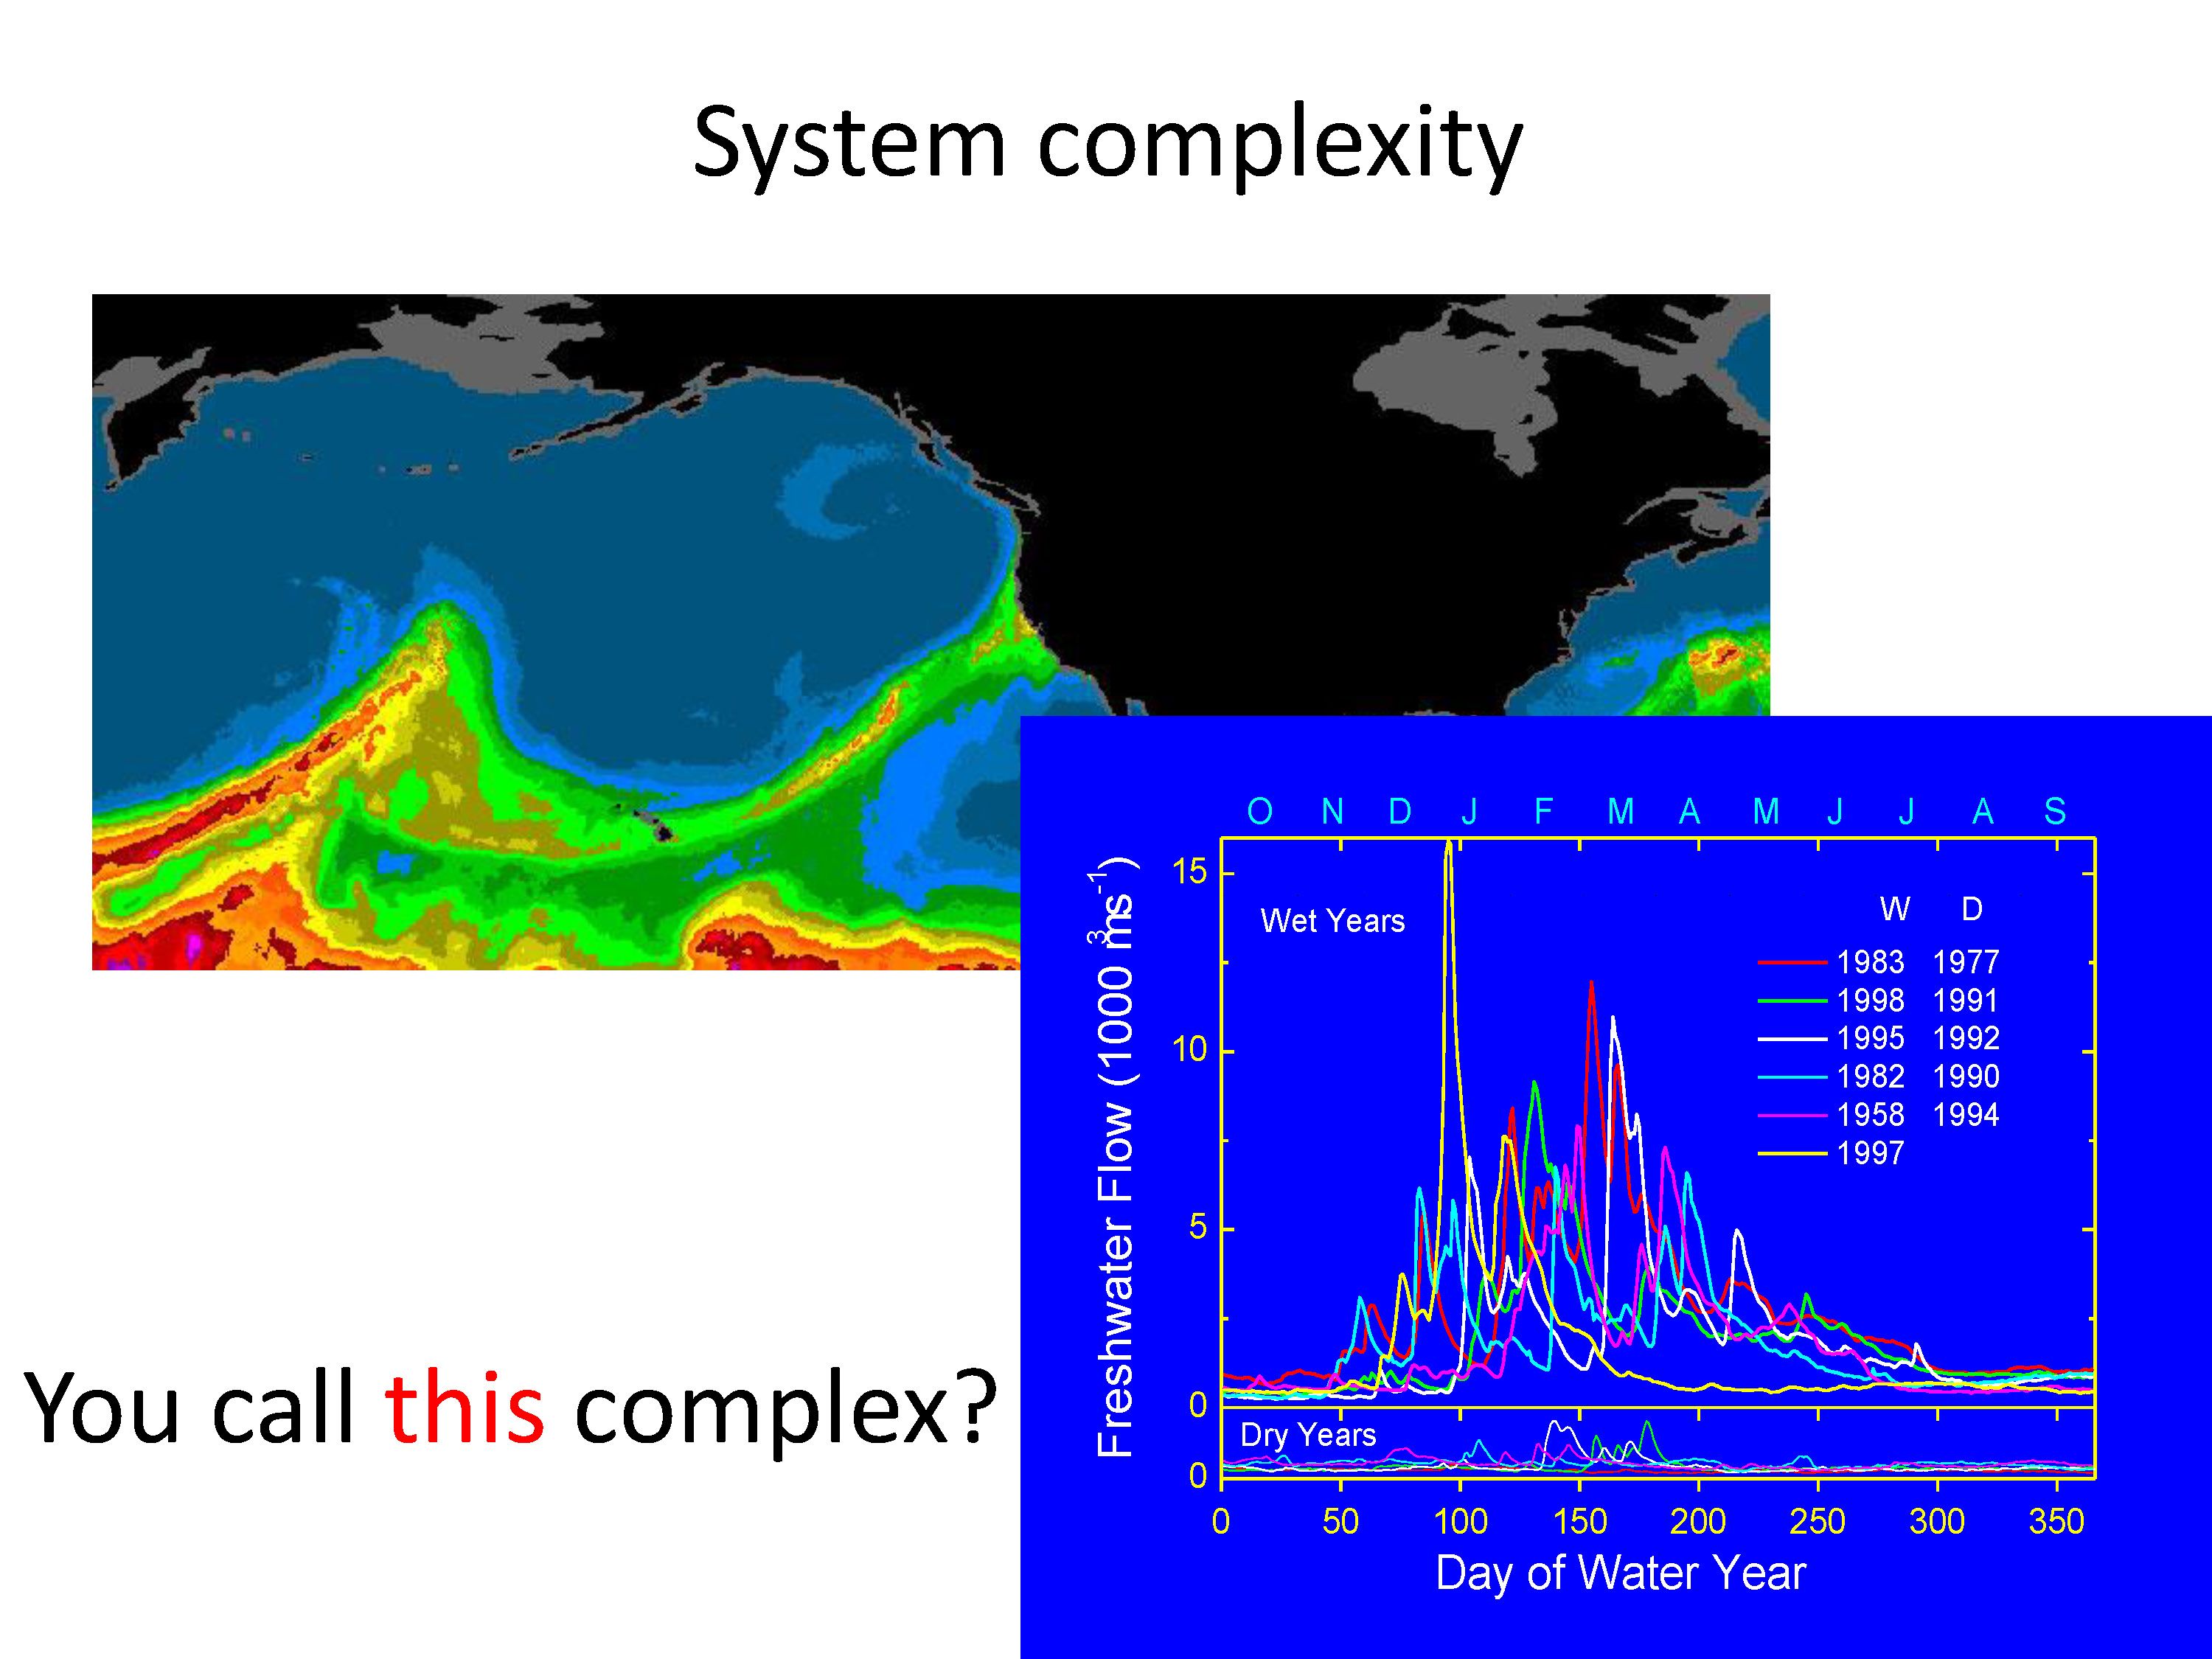 Dr. Kimmerer said that we think of weather being a complex system. “We know about atmospheric rivers being hard to predict and hard to figure out … We do know they are a big deal for the hydrology, but these are very complicated, complex physical systems,” he said. He noted that the graph shows the six highest and six lowest flow years on the same time scale. “You can really see the inter-annual and intra-annual variability. We all know how this works, and you would probably say this is complex, but I’m here to tell you that’s a pretty minor part of it.”
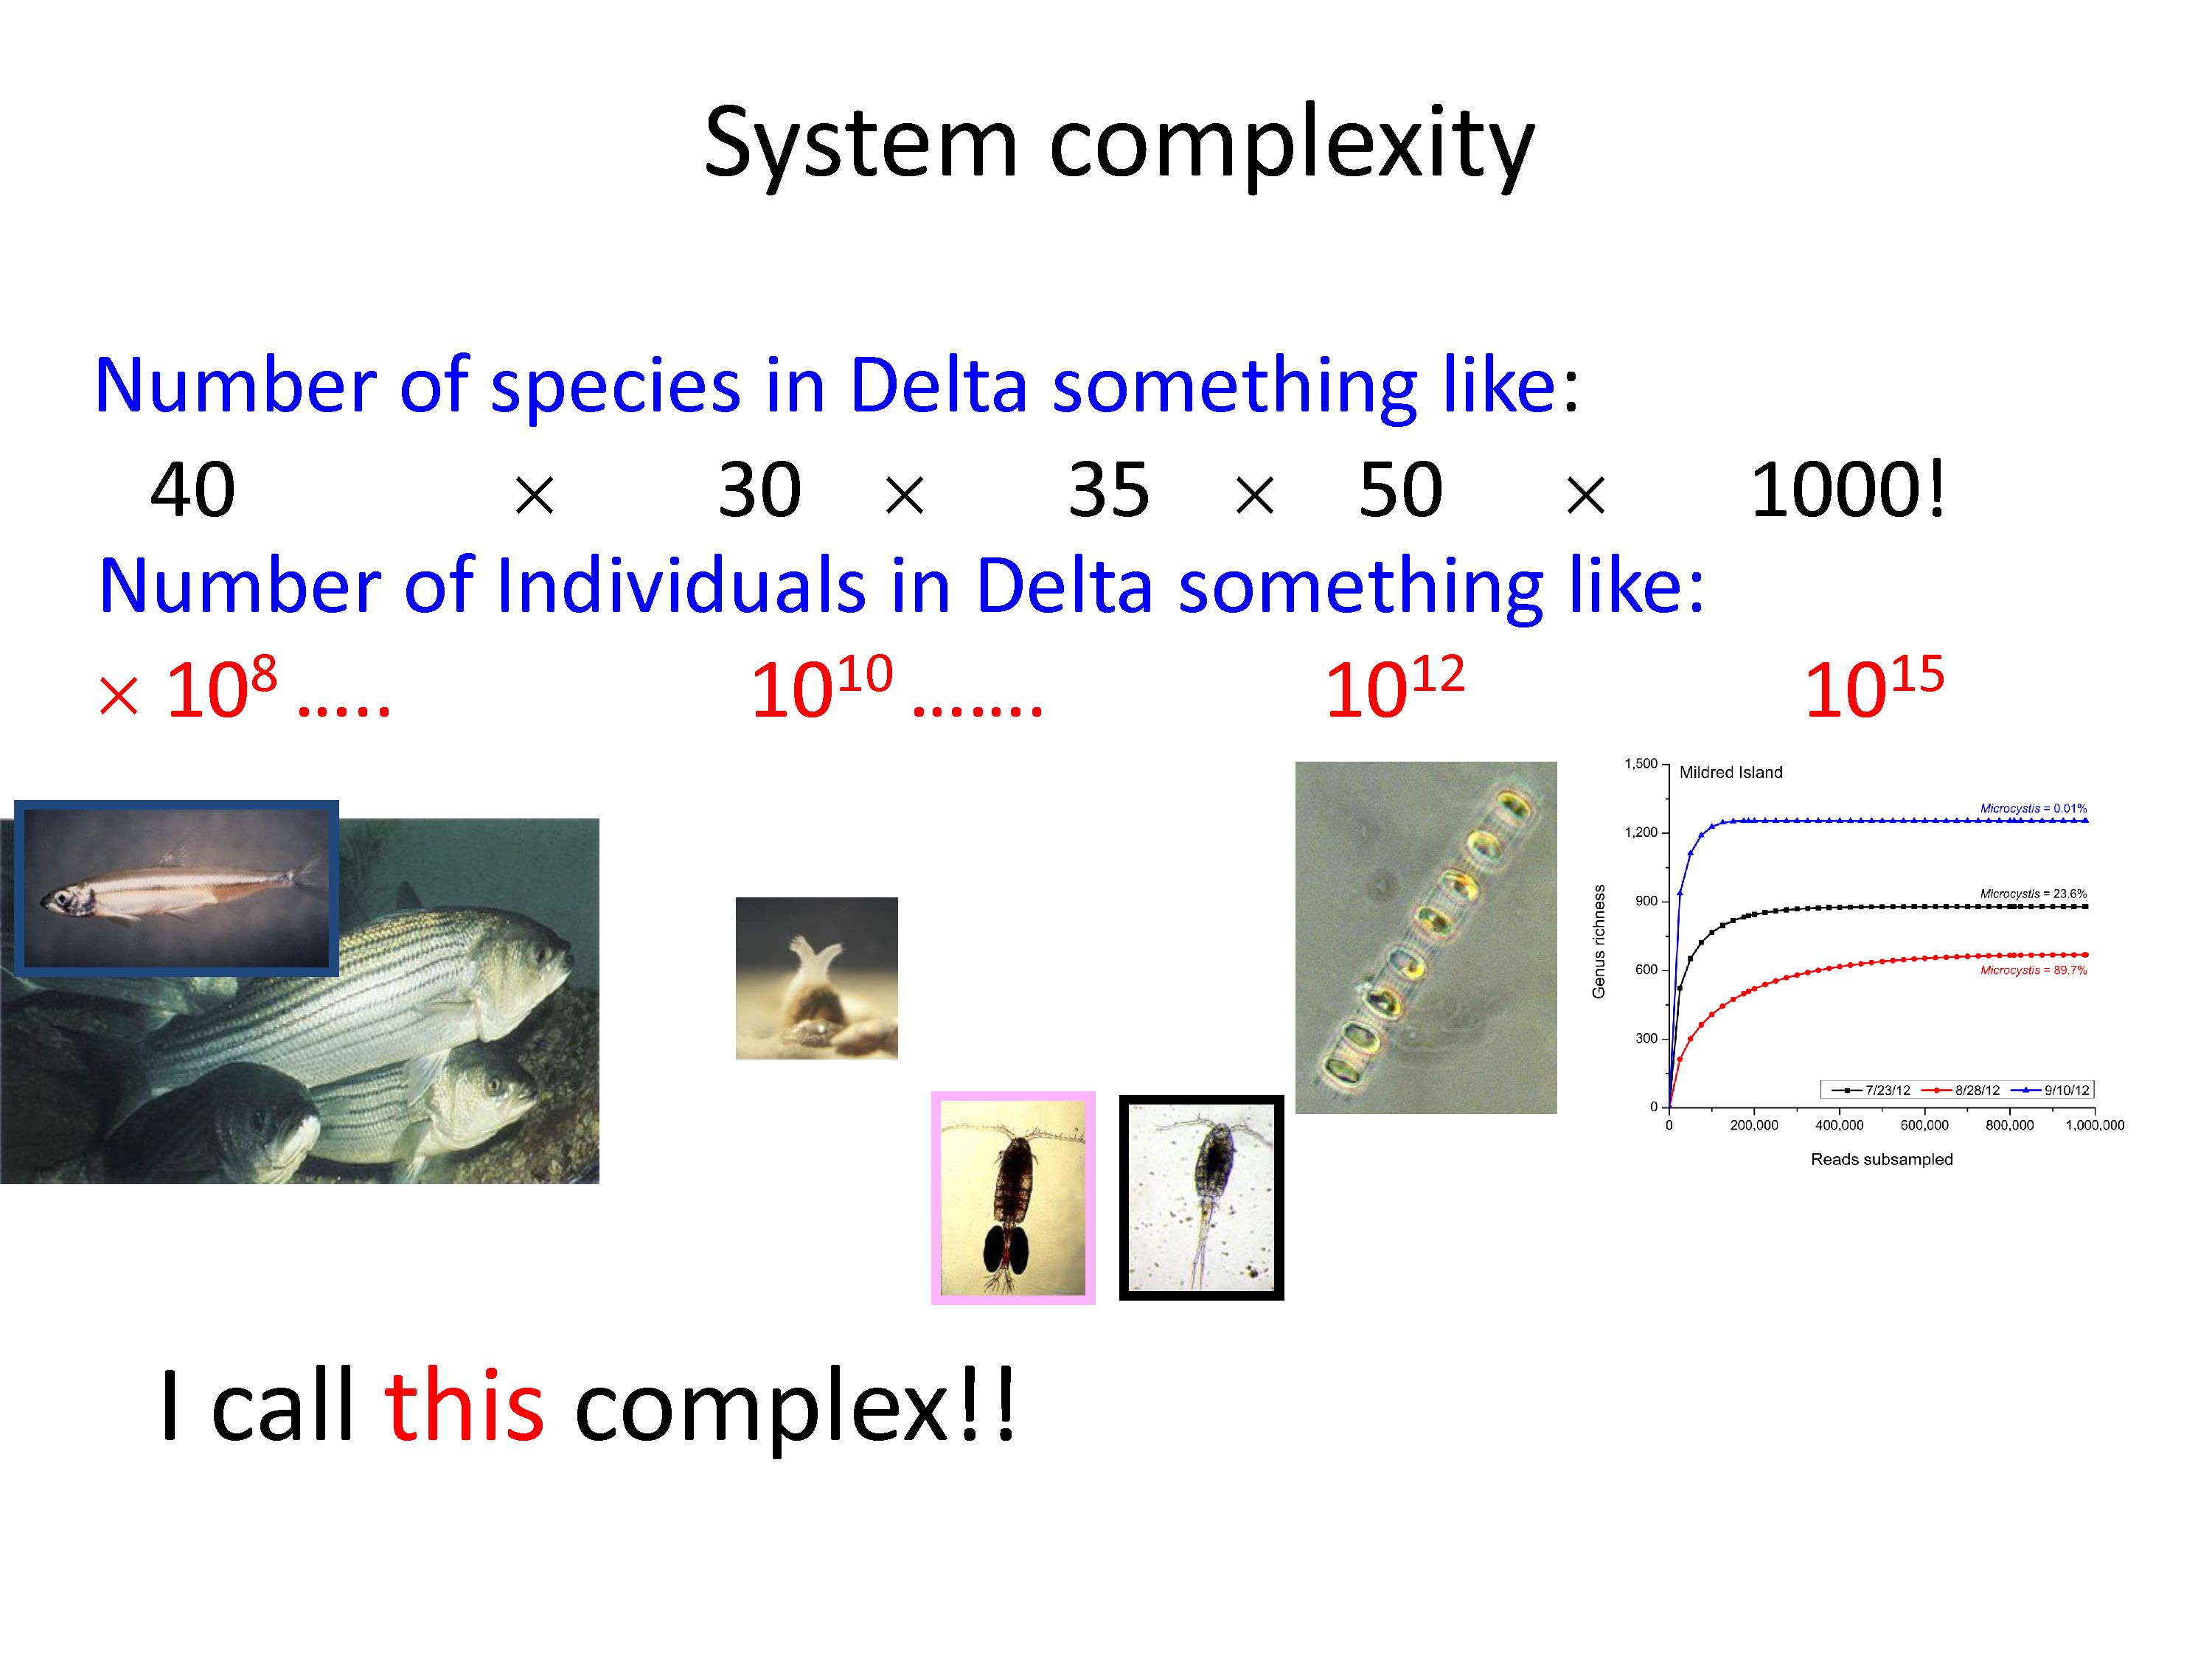 “We have 40 fish species, something like 30 or so species of benthic invertebrates, 35 zooplankton species, 50 species of phytoplankton or so, 1000-ish microbes,” he said, noting these are rough numbers. “The population of a species is a human construct. If you think about what’s going on in the water, they are not all interacting with each other – it’s all individuals interacting with individuals. So you have to think about how many there are, and there’s about just less than a billion fish and a little over a billion benthic organisms and zooplankton and a trillion or so phytoplankton cells, and a godzillion microbes, so this is what I would call complex.”
“It’s complex because a lot of those things, they are not all interacting with each other, but a lot of these individuals are interacting with a lot of the other individuals and that’s changing over time as they move around, and their abundances wax and wane,” he said. “So when it comes to trying to figure out how this ecosystem works, we’re only scratching the surface by looking at the body count, meaning how many fish there are. We’re really missing out.”
Dr. Kimmerer noted that when they go out and do trawls, the first time they catch 5 Delta smelt, the next time they catch 10, we say Delta smelt are going up. “No, those are small numbers; they are unreliable,” he said. “You need hundreds to figure out what’s going on. So not only are we dealing with a system that’s complex by its numbers, we’re also dealing with measurement methods that are increasing the complexity by their paucity of numbers.”
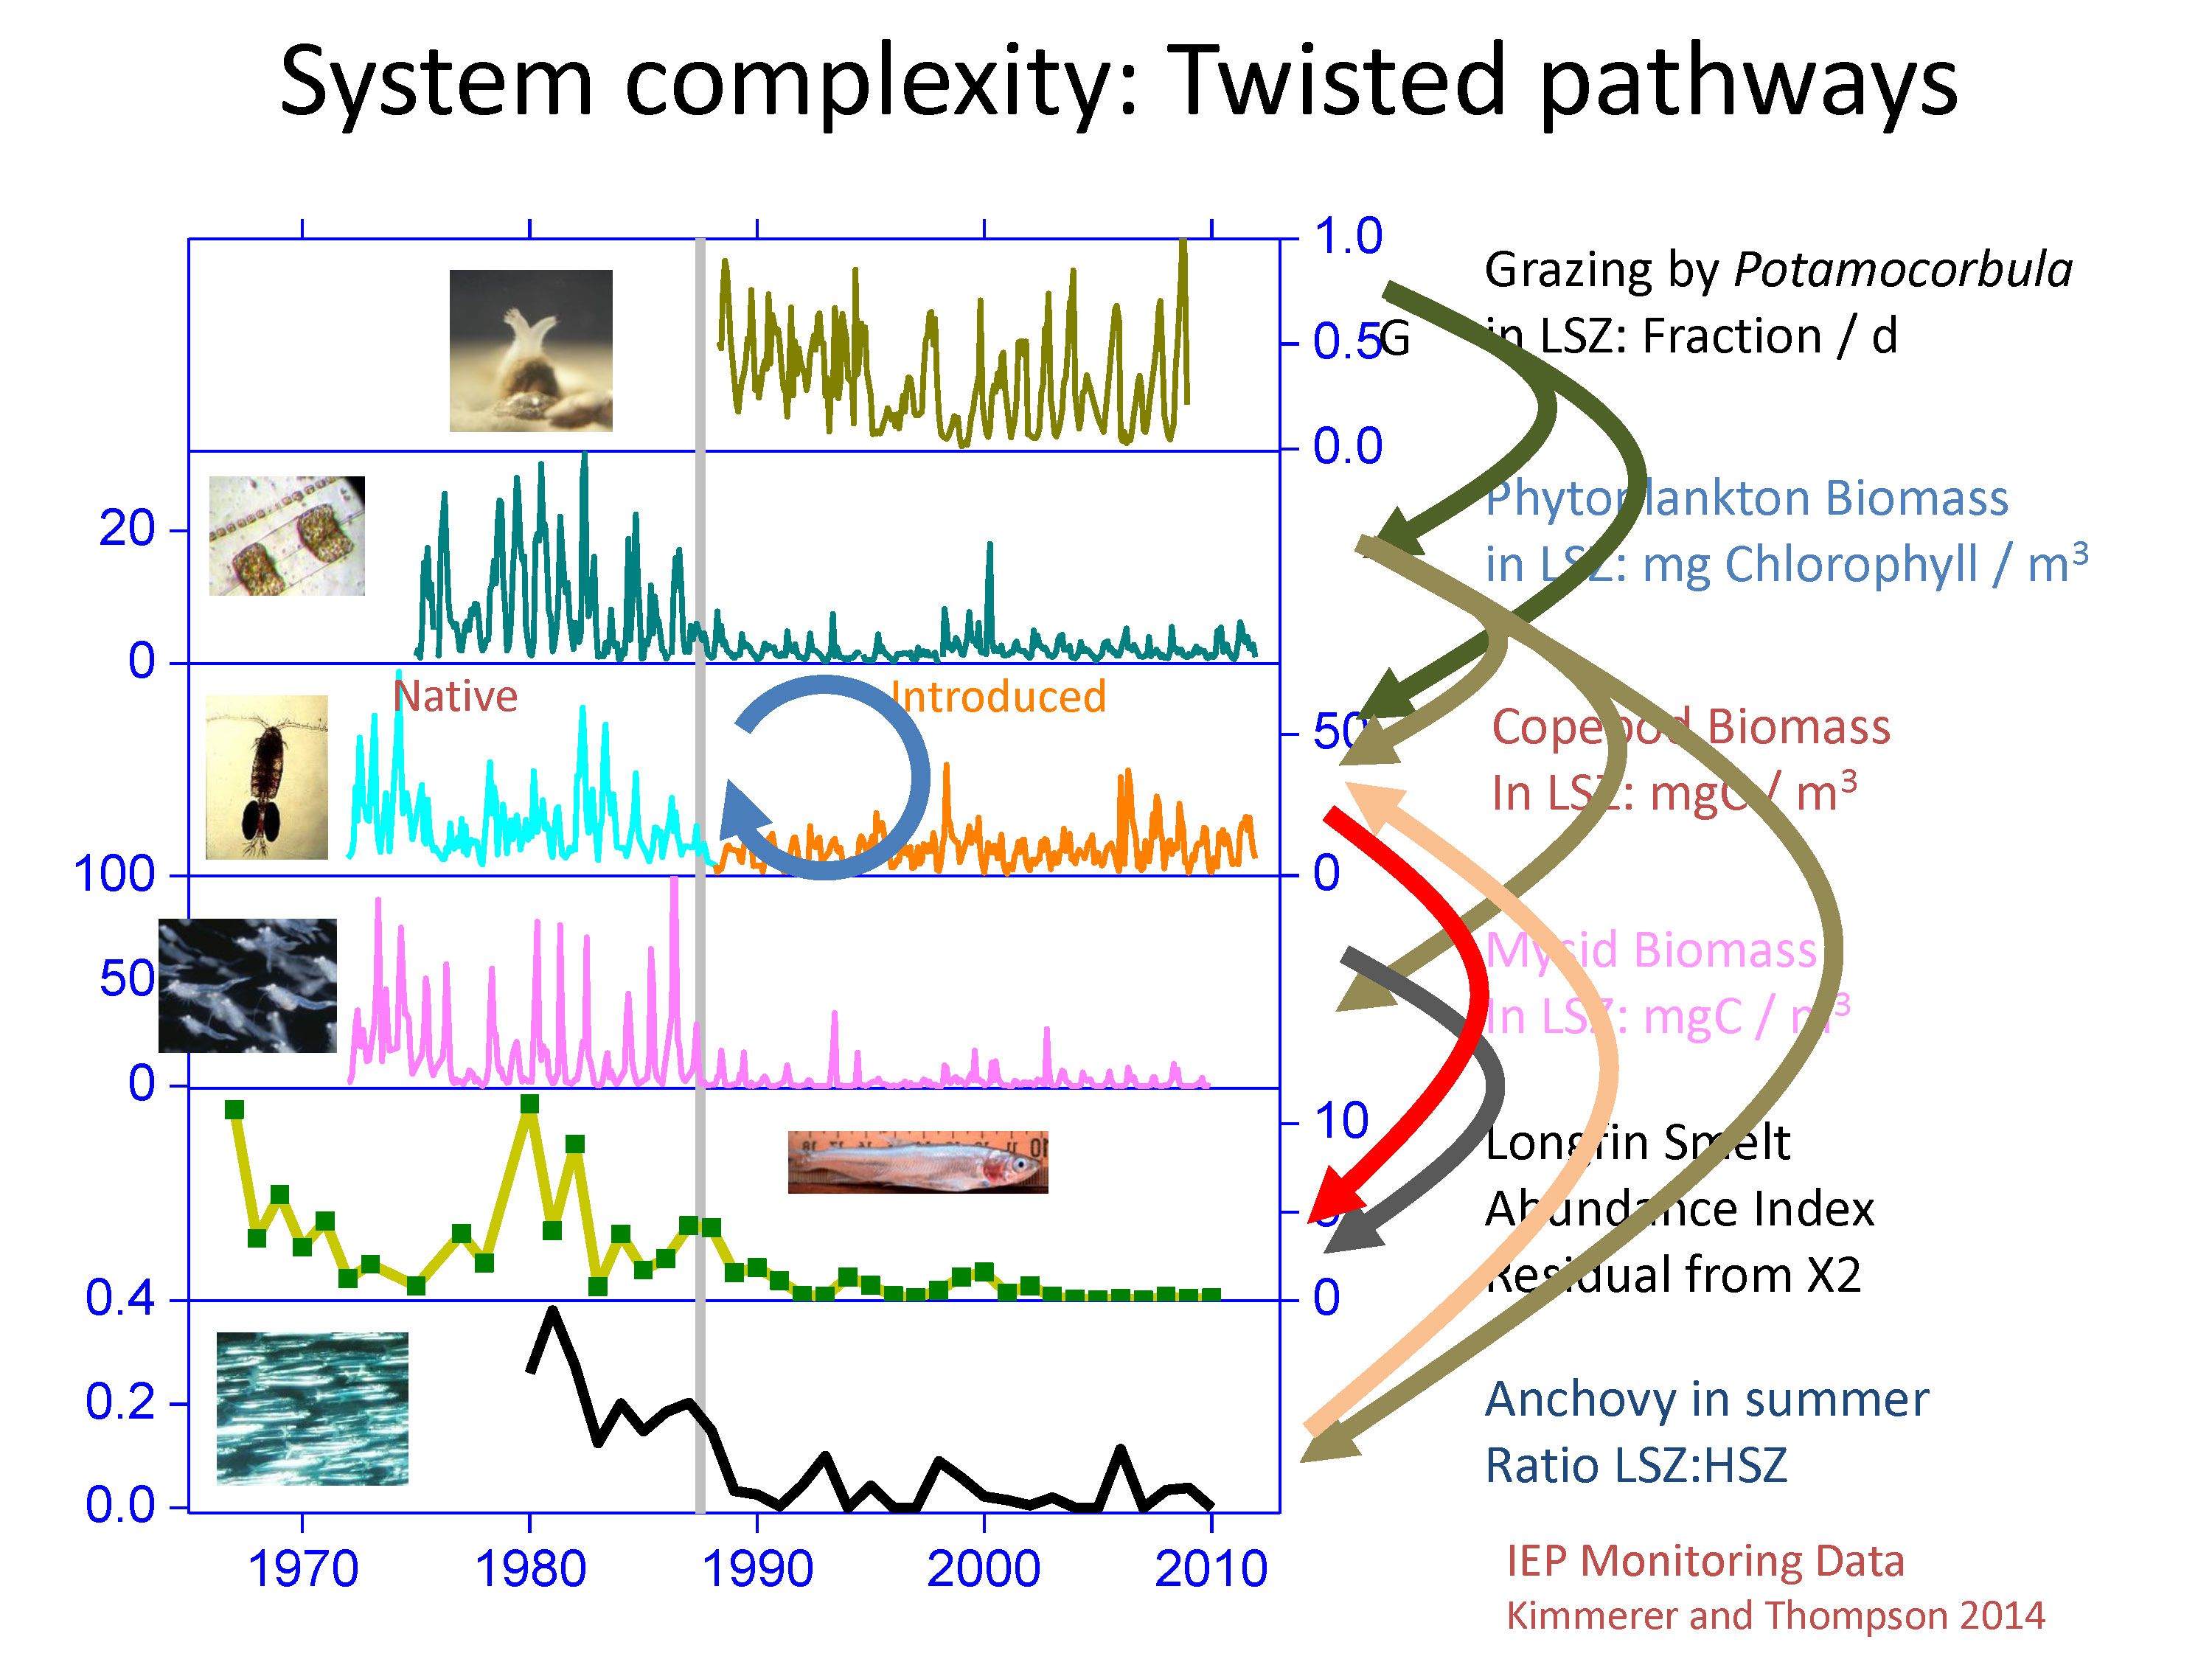 “When you actually begin to get a handle on the Low Salinity Zone in this estuary, you begin to get a handle on how some aspects of it work, and you can start to see some very weird things going on,” he said, presenting a slide of time series of abundance and biomass indices of several species. He noted that the first slide is grazing by potamocorbula, the second is phytoplankton biomass crashing, the third shows a decrease in copepods but not as big of a decrease; next is myocin biomass crashing, long fin smelt index going down, and anchovies going way down.
“This mystified us for a while, but I’m going to explain to you why that happened,” he said. “The grazing whacked out the phytoplankton and some of the zooplankton indirectly, and the decline in phytoplankton caused a loss of food for the zooplankton, the copepods, the mycids, and also the anchovies, and that’s why the anchovies left. They basically bailed; they said this place isn’t suitable for us anymore, and they can find better food further down the estuary.”
“There was a consequence to that,” he continued. “Anchovies previously were by far the most abundant fish in the low salinity zone and they were about three-quarters of the biomass, so when they left, that changed things. We also had the decrease in mycids that had a big effect on longfin smelt, which feed on mycids as they grow, and so when the anchovies left, they opened up a niche for the copepods.”
“A few years later, we had a series of introductions that all happened more or less at once,” he said, noting that one was a predator on the previous numerical dominant there,” Dr. Kimmerer said. “That had a further depressing effect on the food available, not just to longfin smelt, but to Delta smelt and striped bass and other fish as well.”
 When you look at this mess, it’s a lot of work to try and tease apart and figure out whose food limited and whose not. “It turns out that pretty much everybody on this list except the phytoplankton is food limited, and some of them severely, so it’s basically a bottom up limited system – not that every single species here is bottom up limited itself.”
“We have a lot of uncertainty,” Dr. Kimmerer said. “We kind of lump everything together in uncertainty, regardless of where it comes from, and some kinds of uncertainty are different than other kinds. One kind of uncertainty is that the system is variable. Much like we don’t know when the atmospheric river is going to show up on our doorstep, and we’re never going to know when more than a few days out. So that’s the kind of uncertainty we just have to live with and learn how to average over or deal with in some way.”
“The second kind of uncertainty is that we’re ignorant, and if we studied more, if we did some more work, we’d figure it out, or we could figure it out,” he said. “And the third kind is that I’ve got some data, and I show you my data, and you’ve got some data and you show me yours, and we disagree on what’s going on. Now the second and third kinds of uncertainty are at least in theory amenable to resolution by science.”
Dr. Kimmerer said there are some major questions that we’re not in a very good position to resolve, and it’s partly because we haven’t taken the time or haven’t put the effort into figuring them out:
The effect of export pumping on fish populations. “A few other people have written some papers on it, but we really don’t know what the population level effects of the export pumping.”
The importance of food limitation. “We think that a lot of things are food limited, but we don’t know how much that matters in relation to the other things that are going on. Is that the major cause of the pelagic organism decline, for example?”
Moving the point of diversion. “We could solve part of the problem of exports if we could more the point of diversion, but that’s going to do something else to the system,” he said. “How does the hydrodynamics of the system change, and how does that in turn change where the fish move and how they move and what else happens. It’s not simple. We can’t just sweep it under the rug.”
Resolving the ammonium question. “There are some of us here who don’t think there is an ammonium question, but there must be because people keep talking about it,” he said. “It’s very well suited to an experimental approach, and we have to do it. It’s not cheap, it’s not easy, but it can be done. We have to do it.”
Body count inadequate for ecosystem-level questions. “Most of the data that we have, I call the body count. We have how many fish, how many zooplankton, different species, how much chlorophyll, how many phytoplankton cells and so forth, and from that, we as a community, are expected to give answers about processes,” he said. “That doesn’t make any sense. It’s like you go to the doctor and say I don’t feel well, and he takes your height and your weight and says well, here takes these two pills and call me in the morning. We can’t do it because we don’t know what’s going on inside. We need to know how these things interact, how they behave in their environment, and a whole lot of things that we’re not getting good information on right now because the only time we get that information is when somebody puts in a proposal, gets some 3-year, 2-year, 1-year funding to go out and do something.”
The value of restored marshes to pelagic fish. “This is something we need to know and we don’t,” he said. “Now we have learned a lot. There are over a thousand publications on this system, so we’ve learned an awful lot. … We’ve learned to expect surprises, and we’ve learned that this complex system is not easy to tease apart. It doesn’t yield its secrets readily.”
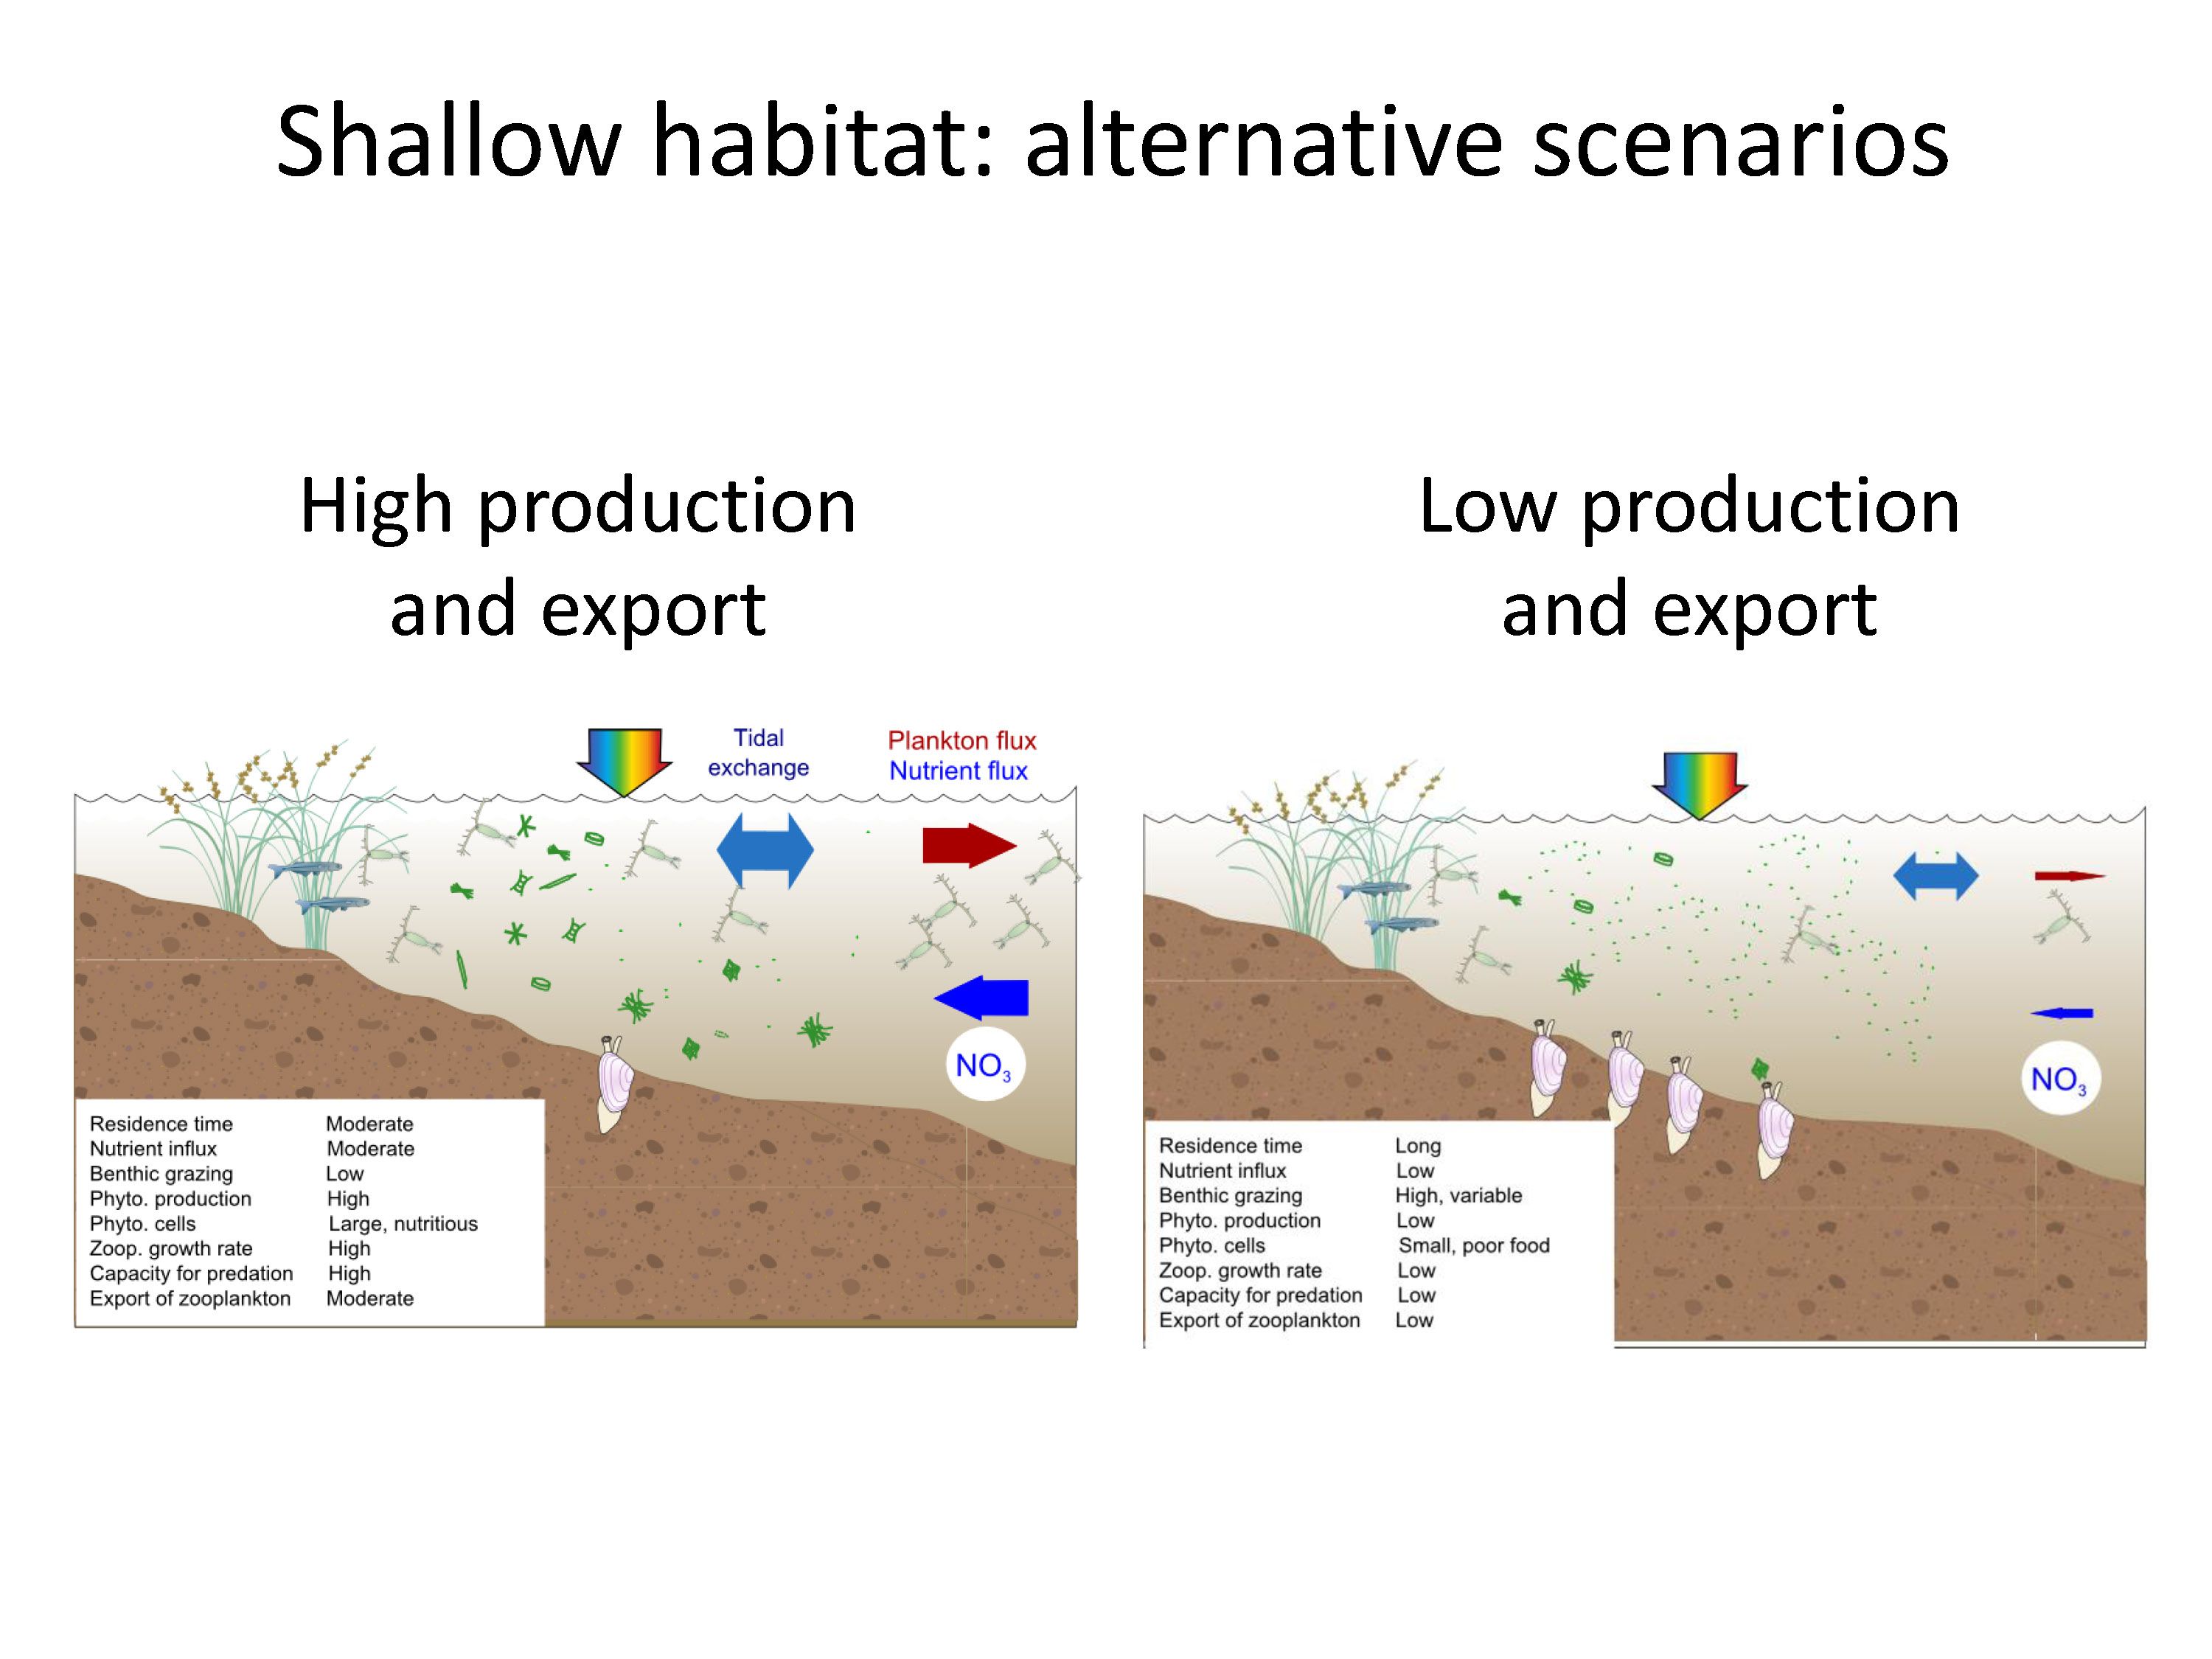 “The question is can restoration reverse some of these declines in the pelagic food web,” Dr. Kimmerer said. “I’m emphasizing pelagic because that’s open water, so there are two mechanisms. One mechanism would be that the little fish go into the marshes and feed there and get energy from the marsh or the shallow area, and the other mechanism is this area exports zooplankton. Two different extreme scenarios, one on the left is a high production scenario, where a lot of stuff leaks out, and then there’s a low production scenario where stuff doesn’t leak out, and it’s not too hard to figure out the conditions that lead to one or the other. But the question is, if you build or restore a wetland that doesn’t now exist, which kind will it be? Where will it be on that spectrum and will it really export food for pelagic fish? The limited literature on this says it will not.”
DR. VAL CONNOR, State and Federal Contractors Water Agency
Contaminants
“So what do we know?” began Val Connor. “One of the things that we do know is that contaminants are one of multiple stressors that are impacting the Bay and the Delta. There have been a number of syntheses done over the last decade, and all of them have concluded that. And most of them have also concluded that if we really want to restore the Delta, it’s going to require that contaminants are managed.”
We also know that we’re at high risk for contaminants in the estuary, Dr. Connor said. “Just in the U.S., we have about 100,000 registered chemicals and 3000 new ones every year, a number of things that come out of treatment plants like cosmetic ingredients and pharmaceuticals, and then of course pesticides we apply in both agricultural and urban areas. So the risk for chemicals showing up in surface waters is high.”
 One thing we know about the Bay Delta is that some contaminants have been detected at levels that suggest to US EPA and the water boards that there’s a problem, Dr. Connor said. “We know there’s a number of persistent organics, we know there are a number of pesticides and that those pesticides are changing over time. We know that we have issues associated with mercury and selenium, and then we also know that a number of times when you go out and collect a sample and you bring it back to the lab and you do a toxicity test – that is, you ask fish, invertebrates and phytoplankton, can you live, grow, and reproduce in this water? often the answer is no, but we’re still not clever enough to figure out exactly what the chemical or chemicals are that are causing that observed toxicity.”
She also noted that cyanotoxins from harmful algal blooms are becoming more common and more spatially distributed, and some constituents of emerging concern are being detected. “We’re seeing a number of industrial contaminants like flame retardants, personal care products like triclosan, the hand sanitizer, and then pharmaceuticals such as birth control, anti-depressants, anti-anxiety, non steroidal anti-inflammatory things, such as ibuprofen, and then caffeine,” she said. “So we do know that there are a number of contaminants that are at harmful levels and then we know that there are a number of other contaminants, and the question is, are those levels harmful.”
 “The problem is that we have a very incomplete picture,” she said. “What chemicals are present in the Delta? We don’t know. We do not have a monitoring program for the Delta. I am hopeful that the Delta Regional Monitoring Program is going to start in 2015 and so this will be a knowledge gap that we’ll start to fill.”
We don’t know much about how contaminants impacting aquatic life, Dr. Connor said. There have been special studies so we have specific examples, but there isn’t a contaminant component to Interagency Ecological Program, and almost nothing being funded in terms of research on contaminant effects, she said. Dr. Connor recalled how at the end of a presentation on contaminants at the Delta Science Program-State Water Board workshop on exterior flows, Denise Reed summed it up succinctly by saying, ‘So you’re telling me there’s been little to no progress over the last five years in understanding the role of contaminants.’
“But we do know certain things, and what we do know, we’ve learned from special studies,” she said. She then gave four examples that demonstrate that there are some lines of evidence suggesting contaminants are affecting the food web in the Delta:
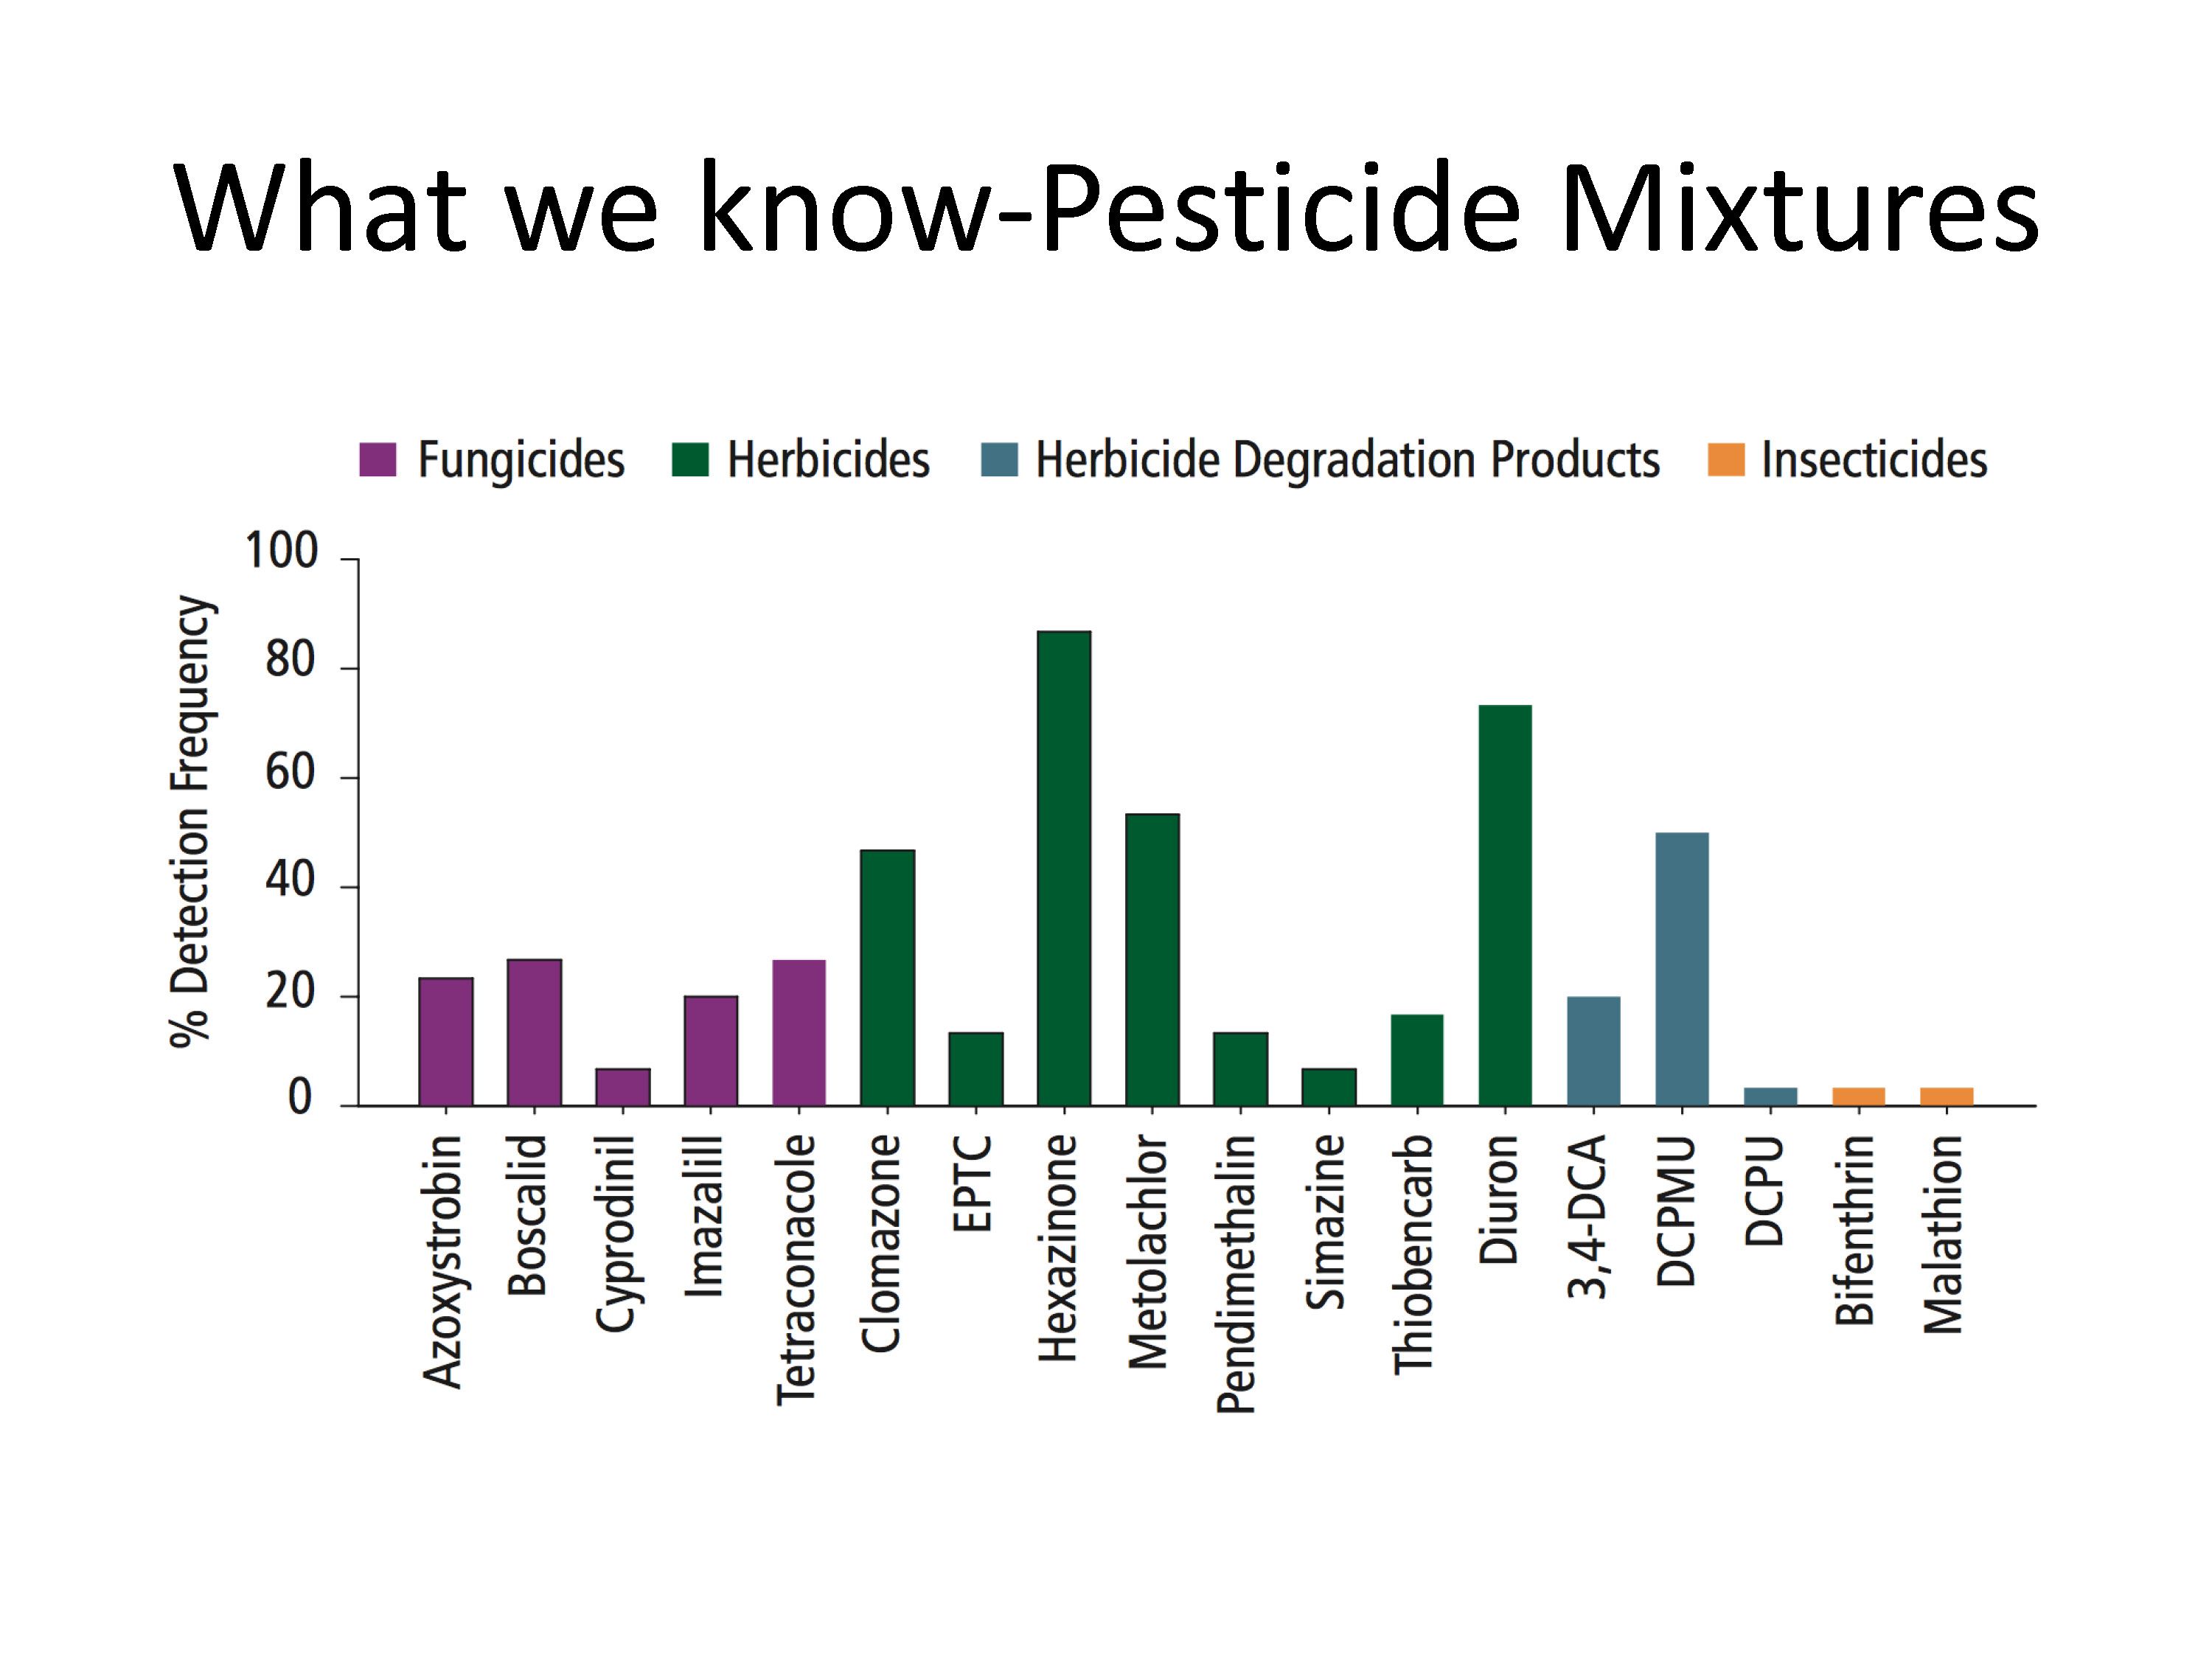 1-Pesticide monitoring from the USGS: In 2010, the USGS developed techniques to monitor for new suites of pesticides that were in use, and then special studies were done to see whether or not the chemicals were detected in the Delta and Suisun Marsh. “Those studies found that in fact, they are, and so the punch line is that they found anywhere from 18 to 34 pesticides present in the Delta, with an average of 9 pesticides in every sample that they took,” she said. “The concentrations they were finding were very low usually, not high enough that you would expect that individually they would cause lethality to sensitive species, but definitely complex mixtures. They did occasionally find pesticides at levels that did exceed thresholds where we would expect mortality to sensitive forms, so the picture that we’re getting from USGS is that there are a lot of pesticides and ones we haven’t looked at typically. We’ve been more focused on the insecticides, and now we’re starting to see herbicides and fungicides, but we really don’t know what happens when you add multiple concentrations of pesticides together. We have started looking… I have to say it’s not an encouraging story.”
2-Toxicity testing: Dr. Connor said that toxicity testing is pretty simple – you collect a water sample, bring it to the lab, and expose larval fish, zooplankton, and phytoplankton at critical life stages and ask the question, can you live, grow and reproduce in this water. “We’ve been doing this now for 25 years, … and essentially what we can conclude is that we all have dirty hands. Sources of pesticides and contaminants are coming from both point and non-point sources.” She noted that a number of contaminants have been identified: diazanon, chlorpyrifos, diuron, pyrethroids, ammonia, and metals.
“The other very common result is that toxicity was detected, but we don’t know what the chemical or chemicals are that are causing that observed response,” she said.
3-Endocrine disruption: There’s only been one study on endocrine disruption that has been done in the Delta. “It showed that we can expect to see both androgenetic and estrogenetic effects,” she said, citing a study done by Suzanne Brander that looking at the pesticide bifenthrin. “Concentrations that we see in the Delta are often more than one nanogram per liter, but at that level in the lab, she was able to show estrogen effects and in fact, more effects when she started looking at the metabolites of that pesticide. She then went out in the field and collected silversides; silversides are kind of neat because they stay near the location where they are collected, so she was looking downstream from treatment plants and also from from cattle ranches, and in fact, downstream from these cattle ranches, she was able to show the masculinization, reduced gonad size and a 30% reduction in fertilized egg output. So in the one time when we’ve looked, we’ve found problems.”
4-Salmon olfaction: Another study looked in detail at contaminant effects on salmonids, and in particular copper, which is widely used in pesticides in the Central Valley, as well as common in urban runoff and mining waste. Low levels of copper have been found to disrupt olfactory receptor neurons and in lateral line mechanosensensory neurons, she said. “It is disrupting fish behavior in that they don’t smell or detect predators, so they don’t have their predator avoidance response. They also tend to be able to avoid high levels of contaminants, but if you knock out their ability to do that, then they don’t have the contaminant avoidance. And there have been changes in their ability to swim. So we’ve seen reduced growth, survivability and reproduction in both Chinook and rainbow trout, and at levels that we see in the watersheds in the Delta.”
There are a lot of technical challenges with contaminants, said Dr. Connor. “There’s the ever increasing number of chemicals, and most of those chemicals do not have analytical methods; in fact it appears that organisms tend to be more sensitive than the existing analytical methods. We also have a lack of ambient chemical monitoring program and also looking at biological effects. If you don’t look, you’re probably not going to find things. But if we were looking, there are a lack of water quality objectives, which is essentially specify what is that safe level, and there is a lack of knowledge of if and how contaminants are affecting key Delta species.”
“This has a negative effect on our ability to understand other stressors, because there’s a real common pattern that I’ve seen, where when folks are doing a study, and the result is sort of inconsistent with their conceptual model in terms of what’s going on in the food web, instead of saying, ‘maybe I need to rethink my conceptual model,’ it’s really handy to say, ‘there must have been a contaminant and we didn’t measure those.’ So we need to be able to understand contaminants if we’re going to be able to understand some of these other things as well,” she said.
There are a couple areas of uncertainty or conflict, Dr. Connor said. “One is, what is the appropriate water quality objective, that limit or regulatory benchmark, and how do we set that so that it’s protective but not over-protective?” she said. “There is a lot of debate about that, because there’s a lot of uncertainty in defining that.”
The other major area of controversy is how to interpret toxicity tests and studies, she said. “If you see a genetic level response, what does that mean in terms of population level effects? If you see a behavioral change, that fish might be more vulnerable to predation or doesn’t seem to be able to use its olfactory cues, again what does that mean in terms of population level effects? One of the things that we have seen with toxicity testing is that the toxicity is usually transient; it’s not that it’s there all the time, but you have pulses that move through the system, and so trying to understand population level effects has been a challenge.”
 As for future challenges, Dr. Connor said one thing we should have learned but appears we haven’t is how to handle pesticide problems. “We’ve gone through five switches of pesticides in the thirty years I’ve been doing toxicity testing: we had organochlorines; then we went to one type of organophosphate then to another type of organophosphate; then to one type of pyrethroids then to a second type of pyrethroids,” she said. “What we seem to do is identify that there is a pesticide problem, and then we switch to a different type of pesticide that is even more difficult to measure because it’s used in smaller amounts and it’s toxic in even lower parts per trillion. So until we figure out how we are going to be able to effectively use pesticides and prevent off-site plumes, we’re going to have a pesticide problem.”
The future challenges of climate change, population growth, hydrology changes, and tidal marsh restoration, can all be imagined to affect contaminants and their effects, Dr. Connor said. “When you change hydrology, you change dilution. When you change temperature, you change the kinetics of any chemical reaction that involves contaminants. We’re going to have population growth; theoretically that could lead to increased loads, although we are getting more effective in trying to reduce offsite movements of contaminants. Then with any hydrology change, you’re going to be changing loads and concentrations. There’s a real question related to tidal marsh restoration and whether or not we’re going to be creating or exacerbating a mercury problem by basically making sites that are good at generating methylmercury that then can accumulate through the food web.”
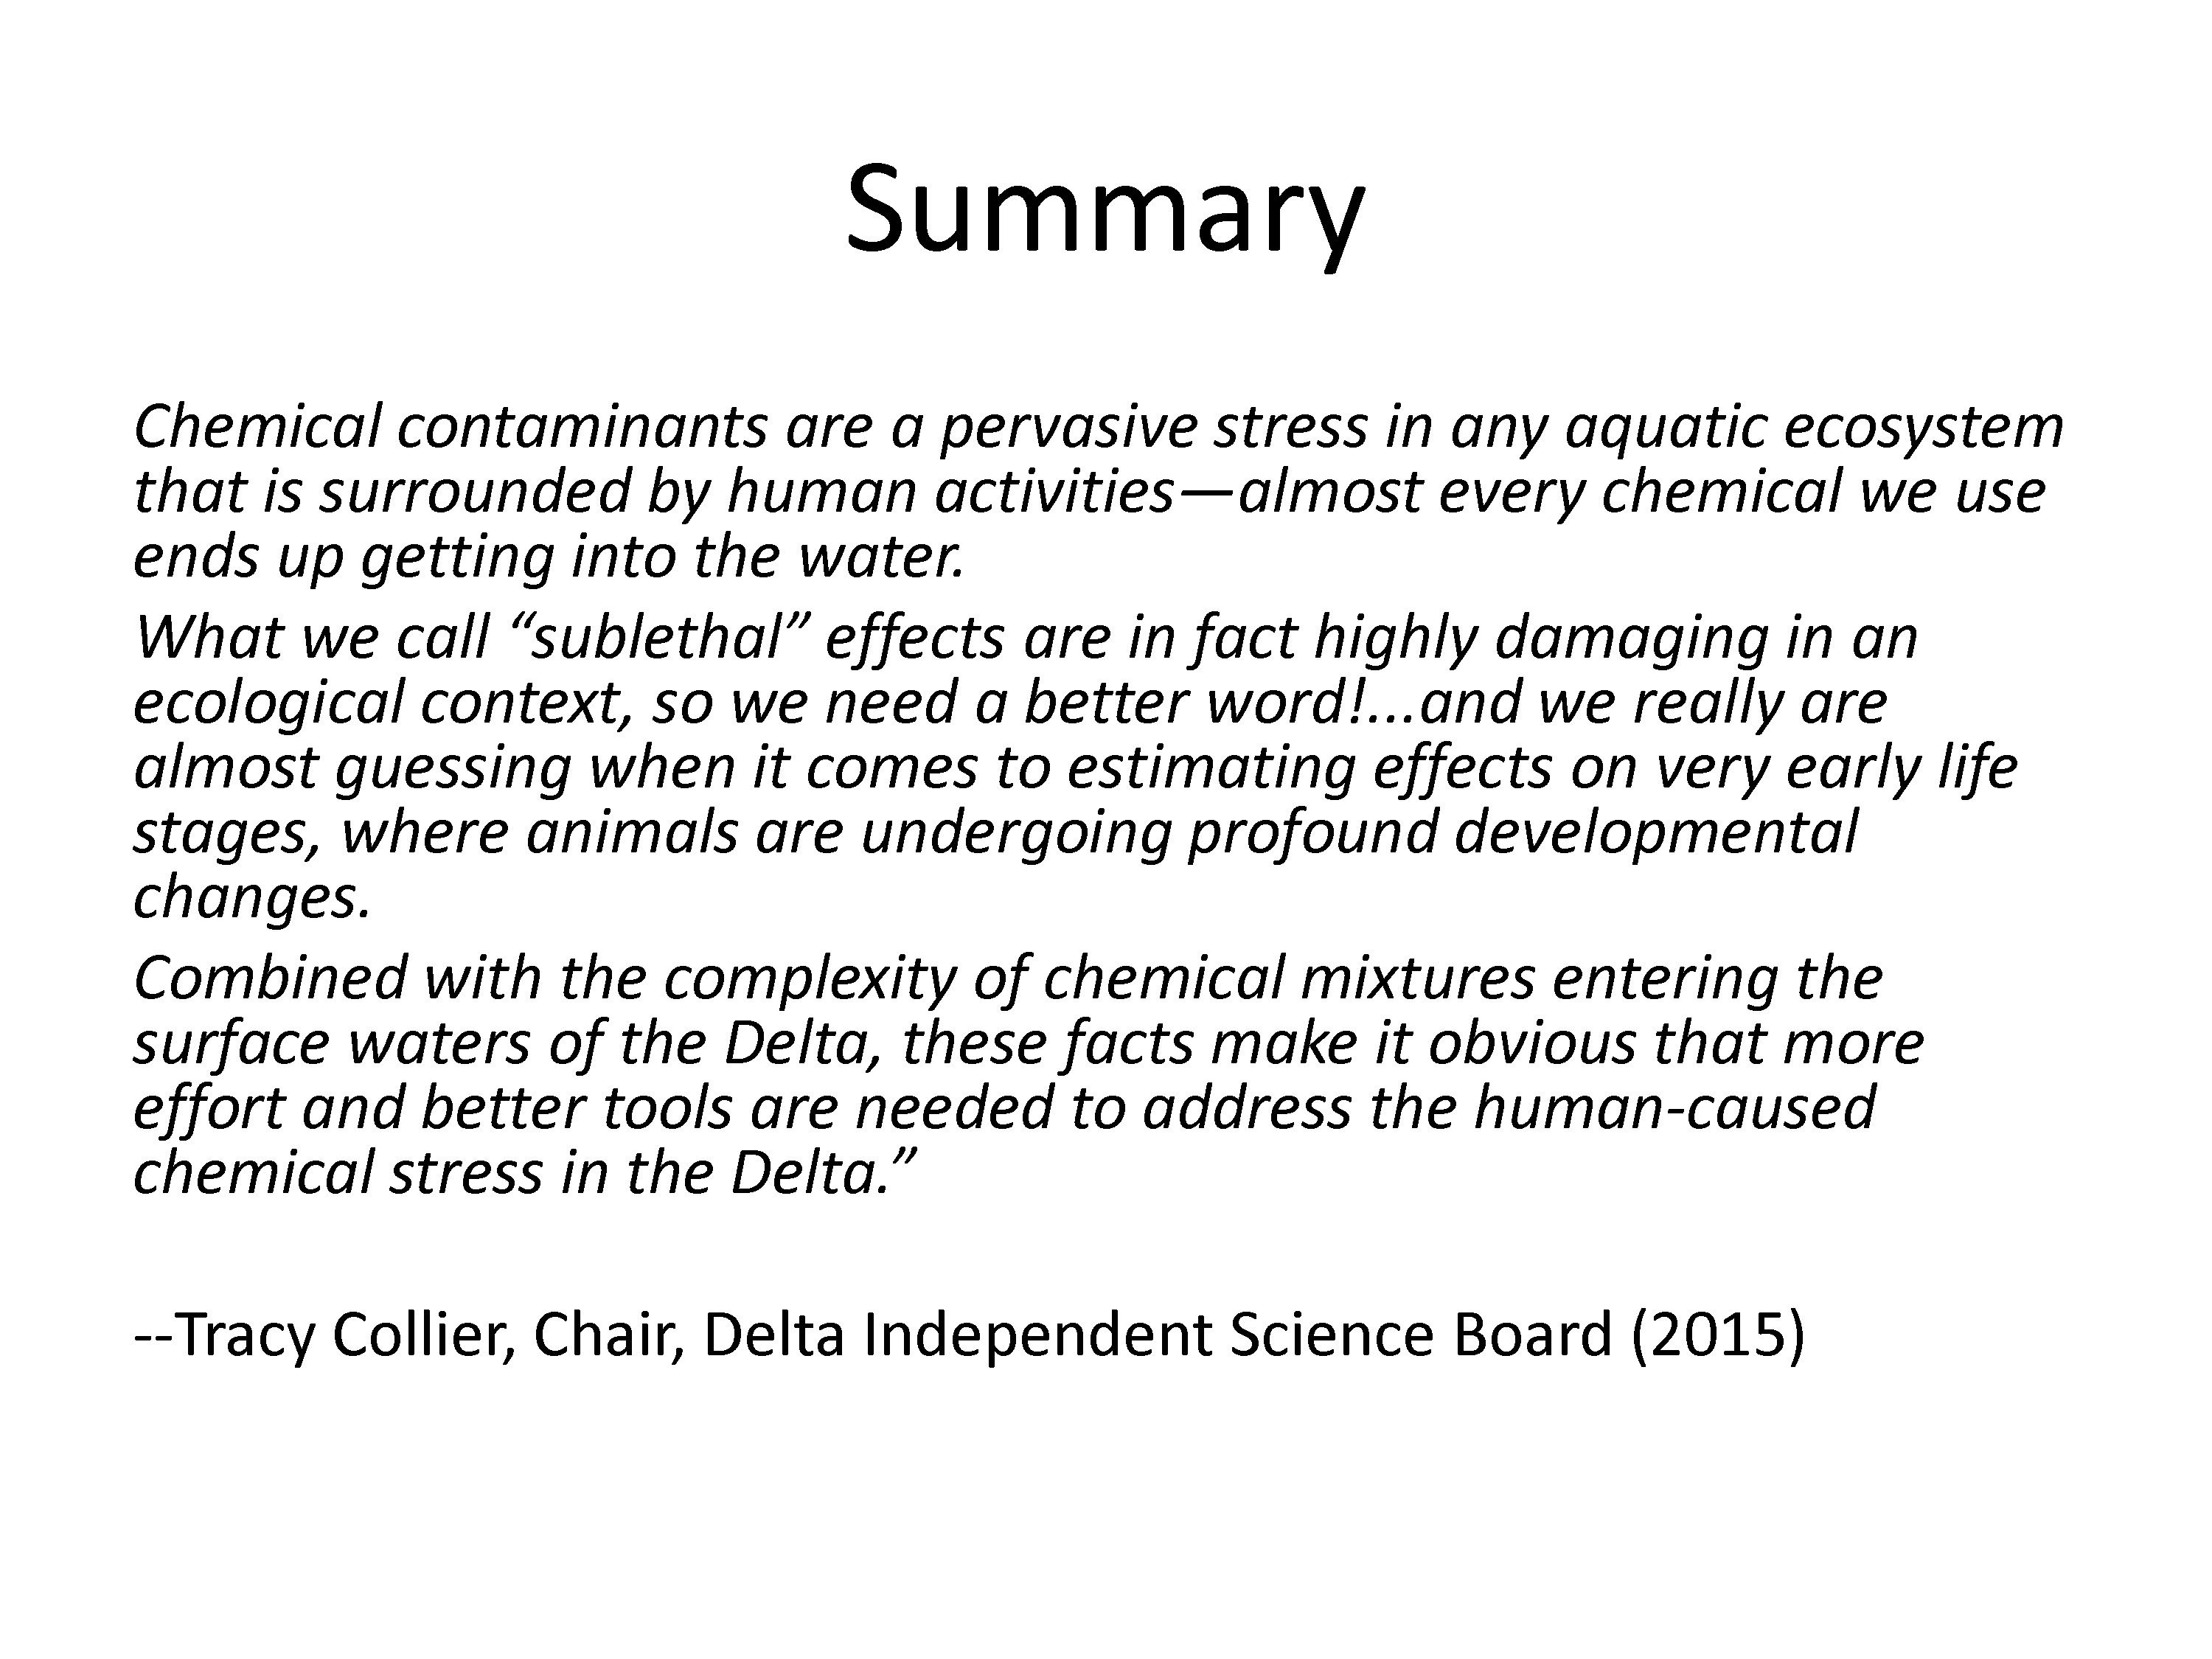 Dr. Connor ended by presenting a slide with a quote from Dr.Tracy Collier, chair of the Independent Science Board. “This is a long way to say that there are a lot of chemicals out there, we’re not really looking at them, we’re not really looking at their sub-lethal effects, and we really need to do that if we really hope to be able to manage contaminants more effectively.”
Discussion session
One of the scientists asked the panel what the potential was for doing large system-level experiments. “How do we move from this approach of monitoring everything and trying to figure it out to developing experiments that get directly at the processes and is that possible to get to some of the complexities so you really have answers in the processes?”
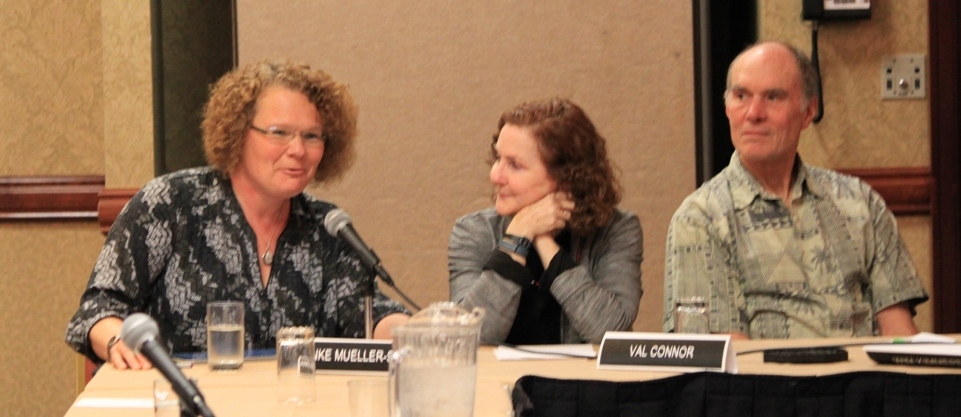 “What people often want to know is, what’s the problem in the Delta? as if there’s this fixed picture we might have of the Delta as partly incomplete, and if we just add a few more pieces then we’d have it,” responded Dr. Anke Mueller-Solger. “It’s often a very stationary idea that we often have in mind, but it’s really a moving target. It’s actually a movie really, not just a picture. In order to get with the movie, I was thinking we need to do three things for sure: One is to monitor, to understand what we’re seeing, or to know what’s going on and what happened in the past; the second is to model what might happen in the future; and the third is to manipulate the system in a way that will tell us more in the experimental sense. We manipulate the system all the time, except we’re not actually looking necessarily to see what we might actually learn from those manipulations that we do, and so I’m talking about active adaptive management and those sorts of things.”
“Your question was, have we done this? Or are we thinking about this?,” continued Dr. Solger. “We actually we have, believe it or not. Not as much as I’d like us to do it, but we’ve done some. We’ve done this with flow with the Vernalis Adaptive Management Program in the southern part of the system. More recently and perhaps even more controversial Fall X2, also known as FLASH, but it was about manipulating Delta outflow to the Bay in the fall in order to benefit Delta smelt … There are all sorts of ideas around, there could be more, important is that there is there good conceptual and if possible numerical modeling to have a good idea of what might happen, which is of course based on monitoring information that we’ve collected in the past, and thenb e really clear about hypotheses, spell them out, and see if they really do happen, predictions, and if not, follow up on it again.”
“Manipulations is what you do when everything else is exhausted, when you can’t do anything more with bottle experiments and understanding the monitoring, because it’s so expensive,” added Dr. Wim Kimmerer.
Dr. Sam Luoma asked the panel if they had any ideas on how to organize the vast amount of information in ways it can be translated to policymakers.
 Greg Gartrell suggested dedicating people to the task of looking at the enormous amount of data and trying to make sense of it. “There is no systematic group of groups within agencies whose only job is to essentially do research on that data, go through and make some sense of it. Too often, it just gets forgotten. It gets pushed aside, and it’s not until somebody really has the time and ability, which is rare, to go dig it out and see if they can make some sense of it, it’s a failure on our own part to not have done this 20 or 30 years ago. Just a group of 5 or 10 people in each agency, if they had that group that just looked at the data and tried to make sense out of it, we’d be a lot better off than we are now.”
Dr. Kimmerer suggested a repository for research. “We have over 1000 publications on this estuary. A new publication comes out and the author sends it around to a few people and it gets out; nobody knows all the papers. There’s no repository, there’s no place to put them, there’s no list. … also the Coastal History Research Federation know has a coastal estuary research news where they highlight articles in their journal and explain them in plain English, what they might mean to people; if we had those two things, it would make a lot of difference in knowing what knowledge was out there and what was available.”
Dr. Healey says he doesn’t think it’s feasible to cover all possible scales, so if you had to pick one or two scales to make some points about complexity in the Delta, what would those be?
“In order to understand what the Delta is as a place, you need to know what’s going on in the watershed to the crest of the Sierras, you need to know what’s going on in the local landscape, you need to know what’s going on in the downstream Bay, and you need to know what’s going on in the Gulf of Farrallons, so I think this spectrum of spatial scales that you need to consider to understand the Delta as a place is a really important concept,” said Jim Cloern.
Greg Gartrell reminded that you need to go down to the small scales as well. “You need to understand the things that are going on biologically from the phytoplankton on up, so the scale problem is enormous, it’s basically the length of California on one end, down to millimeter size on the other.”
“The trouble is you sometimes have to sample at very high frequencies to get these longer time scales that people want to know because the high frequency stuff gets in the way,” added Jon Burau.
“I think you can use it to organize a lot of your information as an organizing principle,” added Dr. Mueller-Solger. “In fact, that’s what we just did with a report that came out this year about Delta smelt, conceptual model, it was totally and explicitly organized by both spatial and temporal scale components, … I do think what Jim said with examples then, a few since you have to be short, you’d get pretty far.”
Dr. Clifford Dahm said that data management doesn’t seem to be effective in this system, and he asked the panelists if they had any ideas on how to get data management up to the next level so you can do the synthesis and integration.
 Dr. Goodwin mentioned the forthcoming white paper from last year’s Environmental Data Summit. “It is really the starting point. What do we need to create a common foundation that agencies and NGOs, water contractors can all buy into? So I would encourage you to take a look at that.”
Dr. Connor said that we’re making progress with the water quality monitoring council, which has been working on developing web applications to access the data with some simple query tools, but there’s still work to be done. “I’m an advocate of tough love. If you want to take state money, you need to tell us where your data is going to be so we can take a look at it, and if you can’t do that in a reasonable amount of time, then don’t come back for state money. We tried that at the water board and it was incredibly effective.”
Dr. Sam Luoma asked if the Delta is this more complicated than other places?
“I don’t think so,” said Jim Cloern. “I think the Delta is unique maybe in terms of the magnitude to which it’s been transformed. Its hard on the planet to find a place that’s been transformed as much by so many different activities, but the need to understand how climate variability interacts with the landscape transformations with introduced species, with nutrient enrichment and toxic contaminants, that’s a universal problem in coastal ecosystems. … The essential problem is that we haven’t found the resources to do what it takes to tear this problem apart, so I don’t think the complexity of the problem is unique here. Oftentimes, when we hear the word challenge, it’s followed by the word opportunity, and we’ve got an opportunity here to try and muster the resources to seriously move forward in unraveling the complexity of this place, and that I think is reflected in the Delta Science Plan.”
“We have all the elements in an estuary, we just have more,” said Dr. Kimmerer. “This system is pretty hydrodynamically reticulate, we have more introduced species almost than anywhere else, so we have all these problems stacked up on top of each other, we got urban sprawl, we have agriculture all over the place and all of the chemicals that come with each, so it’s not qualitatively different from other places, it’s quantitatively different.”
Dr. Goodwin noted that in other countries, there is usually one overarching agency in charge and probably one or two factors driving the decision making process. “It seems what’s different here is that there are over 230 agencies with some interest in the Delta, and you’re trying to manage the system for multiple objectives with agencies that have a mission that doesn’t cover everything.
“I don’t think ecologically this is particularly unique,” said Dr. Anke Mueller-Solger. “Estuaries are complex, and we have one of those, but I do think … what’s really unique is that we have an estuary as the hub of a huge water infrastructure for the most populous state in the nation, and that most populous state isn’t just a state onto itself, but rather it’s connected to lot’s of other states and countries by way of the products that are produced by way of the water that’s going through the Delta, so that means there are a ton of stakeholders, from the local to the international, that have some sort of stake in this here Delta. The Delta is obviously a complex ecosystem, and on top of it socially and economically, hugely complex, and then there’s also this fragmentation in who has a say over all of this, and governments and how we come to some sort of management strategy that works for many if not most, so in that sense, it’s actually quite unique. And on top of it, one more thing, it’s not just the most populous state in this nation and an economic powerhouse, but also one with this incredibly uniquely variable climate. … so I think that definitely adds complications, if not complexity.”
 Dr. Anke Mueller-Solger wrapped it up with some final thoughts. “I was the IEP scientist for 6 years and one thing I do feel has changed over those 6 years is that people understand more clearly than ever before how important it is to use our data and analyze it and synthesize it and do it together, do it collaboratively,” she said. “One thing I feel we’re still falling short on is this active adaptive management or any sort of real experimentation, even with the regular, normal types of management actions that we are already doing to really follow up on what we think might be happening when we do these things in a much systematic way, and do the modeling to form hypotheses and come up with predictions and see if these things are really happening or not … This is really hard. We are talking about dealing with a resource that so many people depend on so much, so it’s economically a really tough thing. In order to really learn and answer some of these tough questions, I think the only way is to really get serious and do some of these manipulations in a way that will hopefully help us understand the system better.”
“And it’s an ecosystem, not just some fish species,” she concluded.
For more information …
For workshop agenda, materials, and webex recordings, click here.
Coming up tomorrow …
In the final installment of the Delta challenges workshop, Robin Grossinger, Letitia Grenier, Peter Moyle, Maria Rea, and Matt Reiter discuss fish, birds, and habitat.
![]()
Help fill up Maven’s glass!
Maven’s Notebook remains only half-funded for the year.
Click here to find out how you can help
